

10 Simple Tips for Financial Well-Being
07/01/2026
The Uninterrupted Powerful Rally May Be Over for Now
The four major averages have had an uninterrupted powerful rally for the past nine weeks without a pullback of any magnitude. Historically, it’s unusual after almost a 20% loss to have a straight up rise as we have had from the low on December 26 to February 25 (the peak as of this writing). All four averages (see below) accelerated higher towards their 50-week moving average an area of potential resistance, (circled in pink) for the rally to pause. On Monday, February 25, a potential downside reversal of significance may have taken place. All four averages (see below) made a higher high and closed near their lows of the day. Many times, this is a warning sign of a trend change in the near term. More time is needed to know for sure. However, in my opinion, this looks to be what has happened. A retracement in the near term is possible.
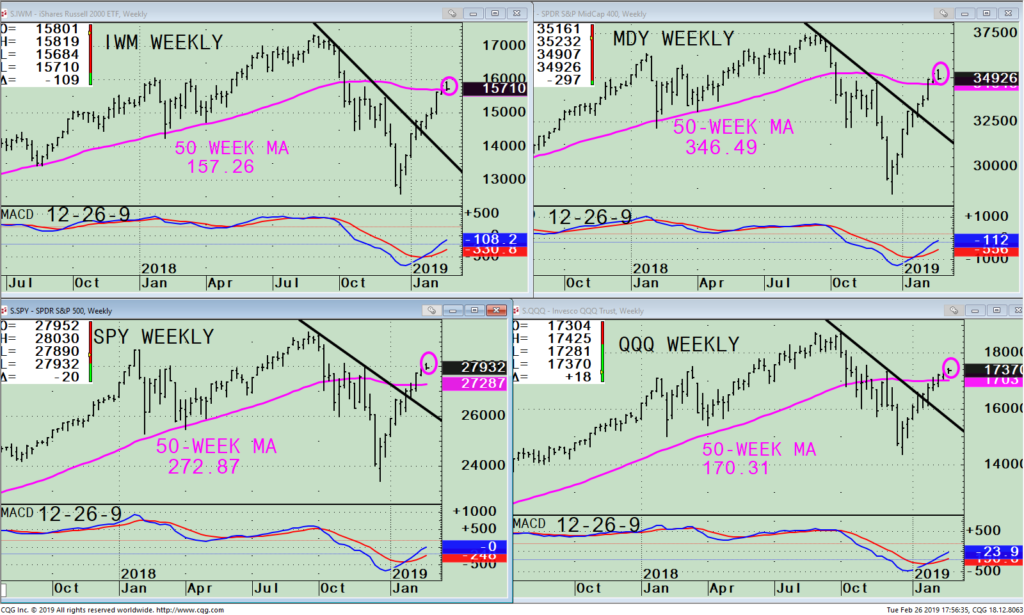
Figure: Weekly Russell 2000 (IWM), S&P 500 (SPY), Midcap 400 (MDY), and Nasdaq 100 (QQQ) Price (Top) and 12-26-9 MACD (Bottom)
Reviewing my article written in the January 23 Systems and Forecasts newsletter, I gave the following upside objectives: Russell 2000 (IWM) 157.11, S&P 500 (SPY) 272.69, Mid Cap 400 (MDY) 346.72, and Nasdaq 100 (QQQ) 170.02. The four major market indices after breaking their weekly downtrends (black line in the chart above) gained between 4 – 8% and reached their upside objectives. A bumpy road may be ahead if all four of the indices close below their 50-week moving average, now a key support level. The Russell 2000 (IWM) is the first index to fall below. Caution is recommended now not to chase stocks at these levels. Pay close attention if all four indices close below their 50-week moving average (see below). This would be a warning sign the short term could be vulnerable to begin to test the December low.
The 50-week MA key levels to confirm the downside reversal as of 2/26 are:
If the downside reversal is confirmed, from a charting perspective, the ideal level to hold is where the averages broke out from (see the black downtrend lines in each of the four charts above). Listed below are support levels, on the index ETFs where a better safer buying opportunity lies rather than chasing the rally now.
Downside Objective Support
Bullish breadth readings and volume thrusts of the magnitude that we have had during the past few months are rare. On the other hand, still looming is there was no test of the December low after the S&P 500 fell almost 20%, also rare. Upside momentum has clearly started to wane. Optimism is high, (a contrary indicator). Daily MACD patterns are extended, in overbought position and close to generating a sell. The market is unlikely to keep up the pace of gain that it has had in January and February. Although I am near term cautious, I believe any decline will be contained to the downside objectives listed above rather than a full retest of the December 26 lows. A decline to these downside objectives would represent a buying opportunity with the expectation of higher prices likely in the coming months.
Watch the Russell 2000 Index ETF (IWM) now closely
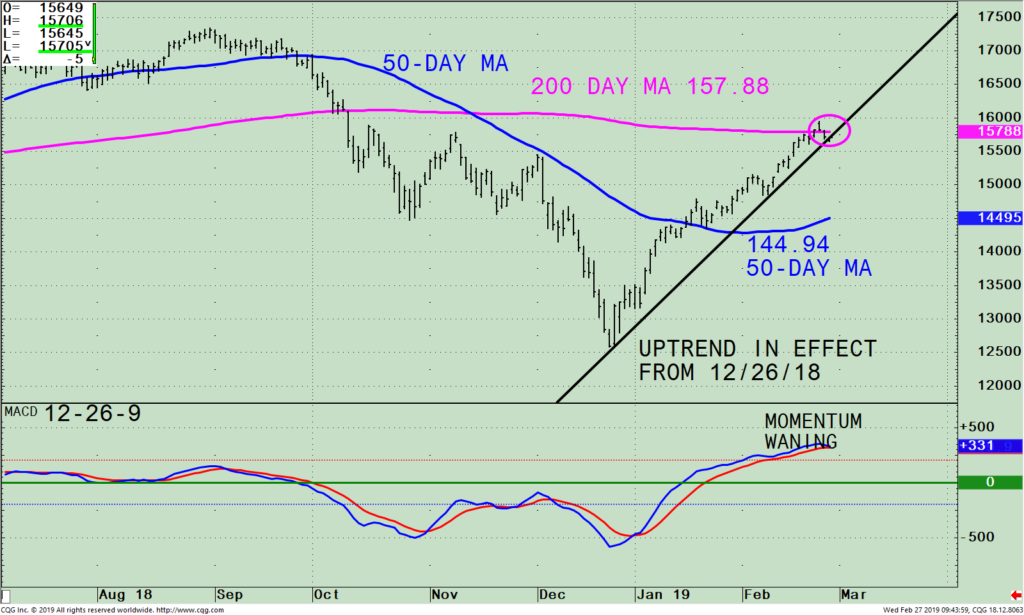
Figure: Daily Russell 2000 (IWM) Price (Top) and 12-26-9 MACD (Bottom)
Above is the Russell 2000 (IWM) daily chart with its 50-day and 200-day moving average that traders and investors tend to follow to define the trend. The IWM is showing a sign of weakness as shown by the IWM closing on Feb 26 below its 200-day moving average (circled in pink). Notice how it’s also hovering just above the uptrend (black line). Further decline will break the uptrend, not a good sign for the near term. An immediate area of support is 144.94, (the 50-day moving average, which is rising) above the 139.0 weekly support level I inferred from the weekly chart above.
The lower chart is MACD, a measure of momentum. A sell signal will be generated in MACD if the IWM continues to decline. Normally after a higher high in MACD, it’s recommended not to take the first sell. However, in this case, with the potential a downside reversal was made on 2/25, I suggest you take this sell.
In Sum
Upside momentum has diminished in the near term. The easy money has been made. A downside reversal may have taken place on February 25 increasing the risk of a short-term decline. Review your portfolio. Make sure you are not overly invested and comfortable with your market exposure. Consider reducing your risk and waiting for another tradeable opportunity to develop in the coming weeks. Downside objectives below if the 50-week moving average is broken by all four indices are: the Russell 2000 (IWM) is 139.00, the S&P 500 (SPY) 263.00, Mid Cap 400 (MDY) 320.00 and the Nasdaq 100 (QQQ) 158.00.
I would love to hear from you. Please call me at 516-829-6444 or email at bgortler@signalert.com to share your thoughts or ask me any questions you might have.
Sign up for a FREE 3 issue trial of
Systems And Forecasts
Click here
******Article published in Systems and Forecasts by Bonnie Gortler February 27, 2019
Disclaimer: Although the information is made with a sincere effort for accuracy, it is not guaranteed that the information provided is a statement of fact. Nor can we guarantee the results of following any of the recommendations made herein. Readers are encouraged to meet with their own advisors to consider the suitability of investments for their own particular situations and for determination of their own risk levels. Past performance does not guarantee any future results.
If you like this article you would love the free
excerpt chapter of my book Journey to Wealth.
Get instant access here


Create more wealth in your life
with these simple strategies.
As an added bonus you will also
receive BG’s Updates and Ezine

Discover how to quickly create more well-being in your life with these simple strategies.
As an added bonus you will also
receive BG’s Updates and Ezine

As an added bonus you will receive BG’s Updates and Ezine

All work listed on BonnieGortler.com is licensed under a Creative Commons Attribution - Noncommercial - No Derivative Works 3.0 Unported License.


Free Report:
Grow and Sustain Your Wealth
Discover how to grow your money with these easy, simple steps.

