

10 Simple Tips for Financial Well-Being
07/01/2026
Did you know there is a big change in the daily stock market tape action from almost two months ago? Back in the August 21 issue of Systems and Forecasts, I expressed concern about the stock market, in part because of relative weakness in small-caps. The major averages moved within a wide trading range as many stocks stopped rising and gave back some of the early gains in the year. However, then the Federal Reserve cut interest rates for the first time since 2008 on July 31st. Historically, lower rates are positive for stocks.
Daily volatility had increased in late August through early September with a high on 9/5 of 1.11% and 1.31%. As of 9/17, the S&P 500 average 25-day daily change was down to 0.79 % and the Nasdaq Composite average daily change was 0.94%. Volatility is now declining. The technical picture is much more favorable. Market breadth has improved considerably. The Cumulative Daily Advance-Decline Line of the New York Stock Exchange Index (NYSE) made a new high on 9/17/19. Now again, the Fed has decided to cut rates in September.
Since the end of August, the Dow, S&P 500, and Nasdaq moved higher exhibiting broad-based stock price strength. There were three consecutive weeks of net advancing issues on the New York Stock Exchange Index (NYSE) including two weeks of more than 1000 net advances. Weak areas of the market that have been lagging this year, have started to show signs of strength. Value stocks outperformed growth stocks which have not happened in over a decade. After being out of favor, investors bought small-cap stocks last week, which sparked a sharply higher rise in the Russell 2000 (IWM) with three +1% up days in a row gaining 4.85%, outperforming the S&P 500 (SPY), which only gained +0.96%.
Also, the Transportation Average, which was also lagging this year, came to life and gained almost 5% last week. Also, international markets have improved. Emerging markets (EEM) rebounded almost 10% from its August low. It’s too soon to know if these trends will continue. However, the tape action is an encouraging sign that more gains may lie ahead. If the Russell 2000 (IWM), Transports (IYT) and Emerging Markets sectors continue to rise and get through resistance just above, the next big move is likely to be to the upside. Not what I had expected. However, a real possibility.
Where do we go from here?
Figure 1: Weekly Russell 2000 (IWM) Price (Top) and 12-26-9 MACD (Bottom)
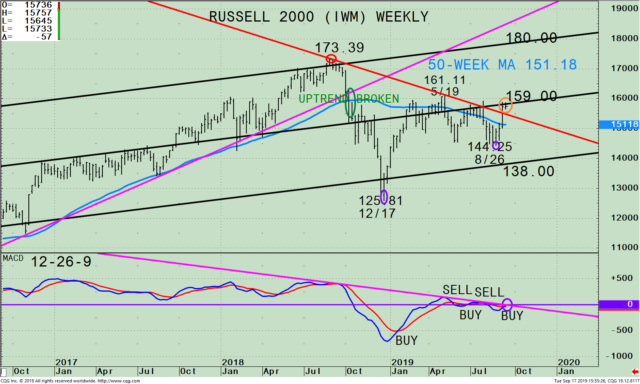
The top portion of the chart shows the weekly (intermediate-term) Russell 2000 (IWM) and its active price channel (black line) with a 50-week moving average (light blue line) that traders watch and use to define trends. (IWM) has been weaker in terms of relative strength compared to the S&P 500 and is approximately 10% below its all-time high. IWM began to weaken in October 2018 after breaking the uptrend (pink line) and falling below the 50-week Moving Average at 159.00 (green circle). Selling accelerated penetrating the lower channel before finally making a low at 125.81 on 12/24. A sharp reversal to the upside followed. The IWM reversed and rallied towards its 50-week MA before peaking on 5/19 at 161.11, slightly penetrating the 50-week moving average. IWM then turned down before making a bottom on 8/26 at 144.25, above the lower channel.
The recent decline looks as if this may be the test of last year’s December low of 125.81 (purple circle). It’s bullish the thrust to the upside on this latest rise is impressive. Last week IWM broke its weekly downtrend (red line) and has penetrated its 50-week MA of 151.18 easily. Resistance is slightly above at 159.00. If IWM rises and has a weekly close above the middle channel at 159.00 it’s likely the IWM will work its way higher. Resistance is 161 followed by the August high of 173.39. The weekly channel gives an upside objective to 180.00.
The lower portion of the chart is the MACD, a technical indicator that measures momentum. MACD has generated a new buy signal after a few quick buys and sell signals. The MACD pattern is favorable, rising from below 0. MACD is now very close to breaking the downtrend. If there is a breakout (which I am expecting), this would imply the downside momentum from the July peak is complete, confirming the price breakout in the IWM.
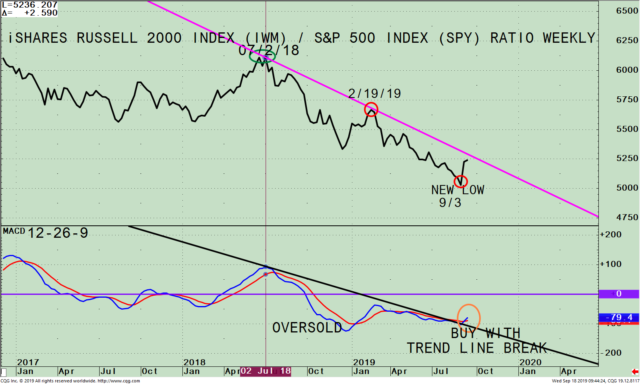
Figure 2: Weekly iShares Russell 2000 Index (IWM)/S&P 500 Index (SPY) Ratio (top) and 12-26-9 MACD of this Ratio (bottom)
The top part of the chart is the weekly Russell 2000 / S&P 500 Index Ratio (IWM/SPY). A rising line means the IWM is stronger, and if falling, the SPY is stronger. The IWM/SPY ratio peaked in 7/2/2018 (green circle) and has been in a steady downtrend throughout the year. It looked like the IWM would be stronger than the S&P 500 (SPY) early this year. However, in February the IWM/SPY ratio turned down and the IWM continued to underperform the S&P 500. The ratio continued to make new lows, trending lower, no sign of strength, until 9/3 (circled in red). The ratio then turned up and is now rising, very close to breaking the downtrend (pink line). This is bullish implying leadership is potentially changing to small caps.
The lower portion of the chart is the MACD of the IWM/SPY ratio. MACD has a very favorable pattern. MACD is rising and has just broken the downtrend from July 2018 (black line) confirming the recent strength in IWM.
Figure: Weekly Biotechnology (XBI) Price (Top) and 12-26-9 MACD (Bottom)
Speculative Buying Opportunity in Biotechnology (XBI)
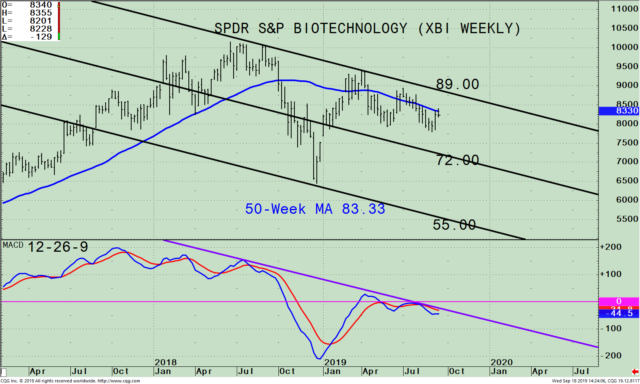
The top portion of the chart shows the weekly (intermediate-term) Biotechnology ETF (XBI) and its active price channel (black line) with a 50-week moving average (light blue line) that traders watch and use to define trends. Many times, during a favorable market climate, Biotechnology (XBI) tends to be a leader of the advance. However, XBI has not shown any leadership since last year. It’s been weaker in terms of relative strength compared to the S&P 500.
Until late 2018, XBI was in an uptrend and above its 50 Week Moving Average. XBI has been in a weekly downtrend as the Russell 2000 has since last July. During 2019 XBI has had several penetrations of its 50 Week Moving average, both up and down within the trading channel but no significant trend. If XBI begins to show strength and closes above its 50 Week Moving Average for two weeks this could suggest Biotechnology will be a sector where investors will rotate money into. Resistance is at 89.00. A break above will imply even further gains.
The lower portion of the chart is the MACD of the XBI/SPY ratio. MACD has a potentially favorable pattern in that MACD is rising and is close to breaking its downtrend from 2018 (black line). A break of the downtrend will imply improving momentum and suggest a possible buying opportunity to develop. I will continue to follow up on how Biotechnology is doing in the future.
Summing Up:
A big change has occurred in the stock market. Small caps are leading in relative strength compared to the S&P 500. This is bullish for the intermediate-term. Keep an eye out If the Russell 2000 (IWM) can close above 159.00. If this happens, a potential rise to 180.00, a gain of more than 13% is possible. With the recent improvement in the tape, I am optimistic the IWM will continue to show strength, break out to the upside, which could ignite the broad market to sharply higher gains. On the other hand, if the Russell 2000 (IWM) falters and makes a new low below 144.25 this would negate my positive outlook. A possible shift to Biotechnology also bears watching.
Drop me a line! I’d love to hear from you. Please call me at 516-829-6444 or email at bgortler@signalert.com to share your thoughts or ask me any questions you might have.
Sign up for a FREE 3 issue trial of
SYSTEMS AND FORECASTS Click here

If you like this article you will love my
Free EBook Grow Your Wealth and Well-Being Ebook
******Article first published in Systems and Forecasts on September 19, 2019
Disclaimer: Although the information is made with a sincere effort for accuracy, it is not guaranteed that the information provided is a statement of fact. Nor can we guarantee the results of following any of the recommendations made herein. Readers are encouraged to meet with their own advisors to consider the suitability of investments for their own particular situations and for determination of their own risk levels. Past performance does not guarantee any future results.


Create more wealth in your life
with these simple strategies.
As an added bonus you will also
receive BG’s Updates and Ezine

Discover how to quickly create more well-being in your life with these simple strategies.
As an added bonus you will also
receive BG’s Updates and Ezine

As an added bonus you will receive BG’s Updates and Ezine

All work listed on BonnieGortler.com is licensed under a Creative Commons Attribution - Noncommercial - No Derivative Works 3.0 Unported License.


Free Report:
Grow and Sustain Your Wealth
Discover how to grow your money with these easy, simple steps.

