

10 Simple Tips for Financial Well-Being
07/01/2026
The major averages were unable to break through overhead resistance, peaking in mid-March. After stocks pulled back in the second half of March, on the last day of the month it looked as if the bulls would again take control as the S&P 500 jumped 1.3%. However, the rally fizzled, the Nasdaq and the S&P 500 fell to their lowest closing levels in almost two months. Trade war talks have spooked investors during a time when chart patterns are somewhat disturbing. Market breadth has been poor, weekly up trendlines have been broken or are in jeopardy. In addition, monthly technical indicators have turned down on many stocks and major averages are forming potential topping patterns.
On the other hand, bonds yields have stabilized, global markets are not panicking, and volume and MACD patterns are very oversold in the near term, setting up potential buying opportunities when the market calms. Stocks are cheaper than they have been in months. For example, Alphabet (GOOG) fell almost 16% from its all-time high on 3/12.
At any time, pessimism could change and investors could turn to bargain hunting, buying stocks again. The good news is that historically April has been one of the best months of the year for gains in the stock market. The Technology sector was the leader of the market and now its leadership is in question. One area to watch now to see if the price can firm is the Russell 2000 Index (IWM), a good measure for the broad market.
Figure: The iShares Russell 2000 Index (IWM) Weekly Price Channel and 12-26-9 Week MACD
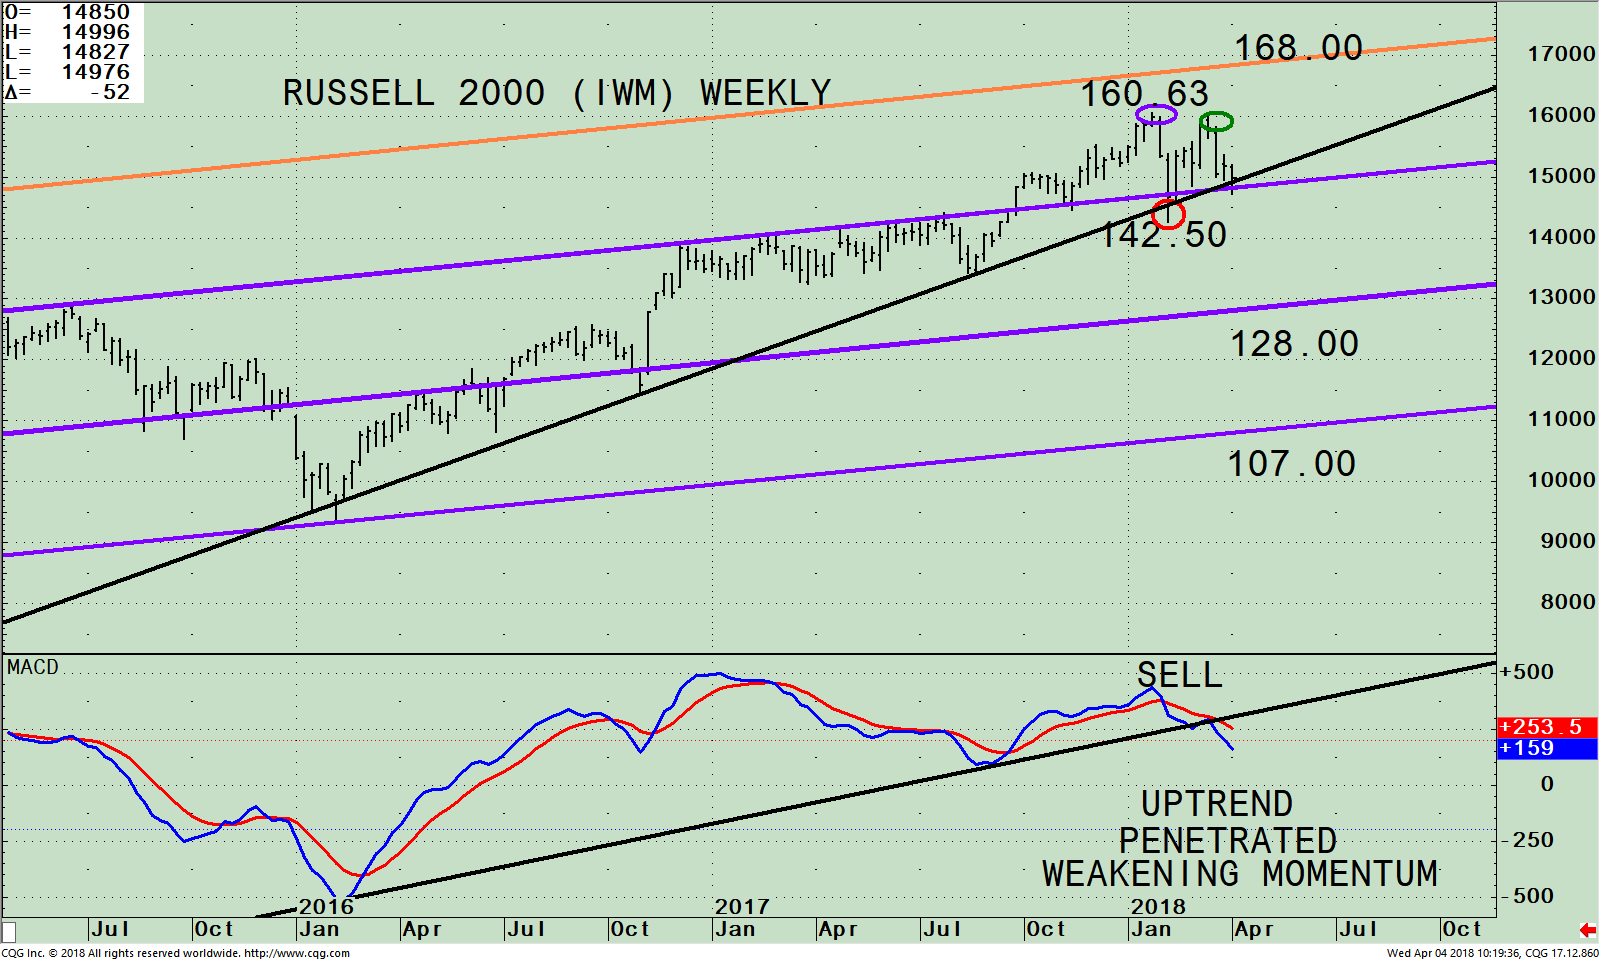
The iShares Russell 2000 Index ETF (IWM) is made up of companies with a market capitalization of between $300 million and $2 billion. The Russell 2000 (IWM) portfolio top sector holdings as of 4/04/18 is Financials 24.20%, Health Care 15.75%, Industrials 14.89%, Technology 14.75% and Consumer Cyclicals 13.39%.
The top portion of the chart shows the weekly Russell 2000 Index (IWM) peaking at 160.63 on 1/24/18 (purple circle), failing to reach the next channel objective (orange line). The IWM then turned down slightly, penetrating the uptrend (black line) that began in February 2016, just under the middle channel (red circle) at 142.50 before turning up. The IWM wasn’t strong enough to make a higher high (green circle), and subsequently turned down. Presently the IWM has retraced back towards the uptrend line that is acting as support. A decline now would confirm the warning that the 12-26 week MACD is signaling, having generated a sell signal and broken a trendline. If we see IWM violate its price uptrend again it would suggest a retest of the low of 142.50 on February 9 is possible.
The downside objectives in the unlikely event that the decline accelerates and takes IWM below 142.50 are 128.00 followed by 107.00. Because IWM is short-term oversold and pessimism is building (a contrary indicator), I am not expecting a decline to the lower objective. Resistance is at 160.00 followed by 168.00.
The lower portion of the chart is MACD, a technical indicator that measures momentum. MACD is on a sell, in an overbought condition and showing momentum weakening. It’s not a good sign MACD ended the two-year-old uptrend that began in January 2016. Risk is increasing as the SPDR S&P 500 (SPY) is also showing loss of momentum for the intermediate term.
Figure: The SPDR S&P 500 (SPY) Weekly Price Channel and 12-26-9 MACD
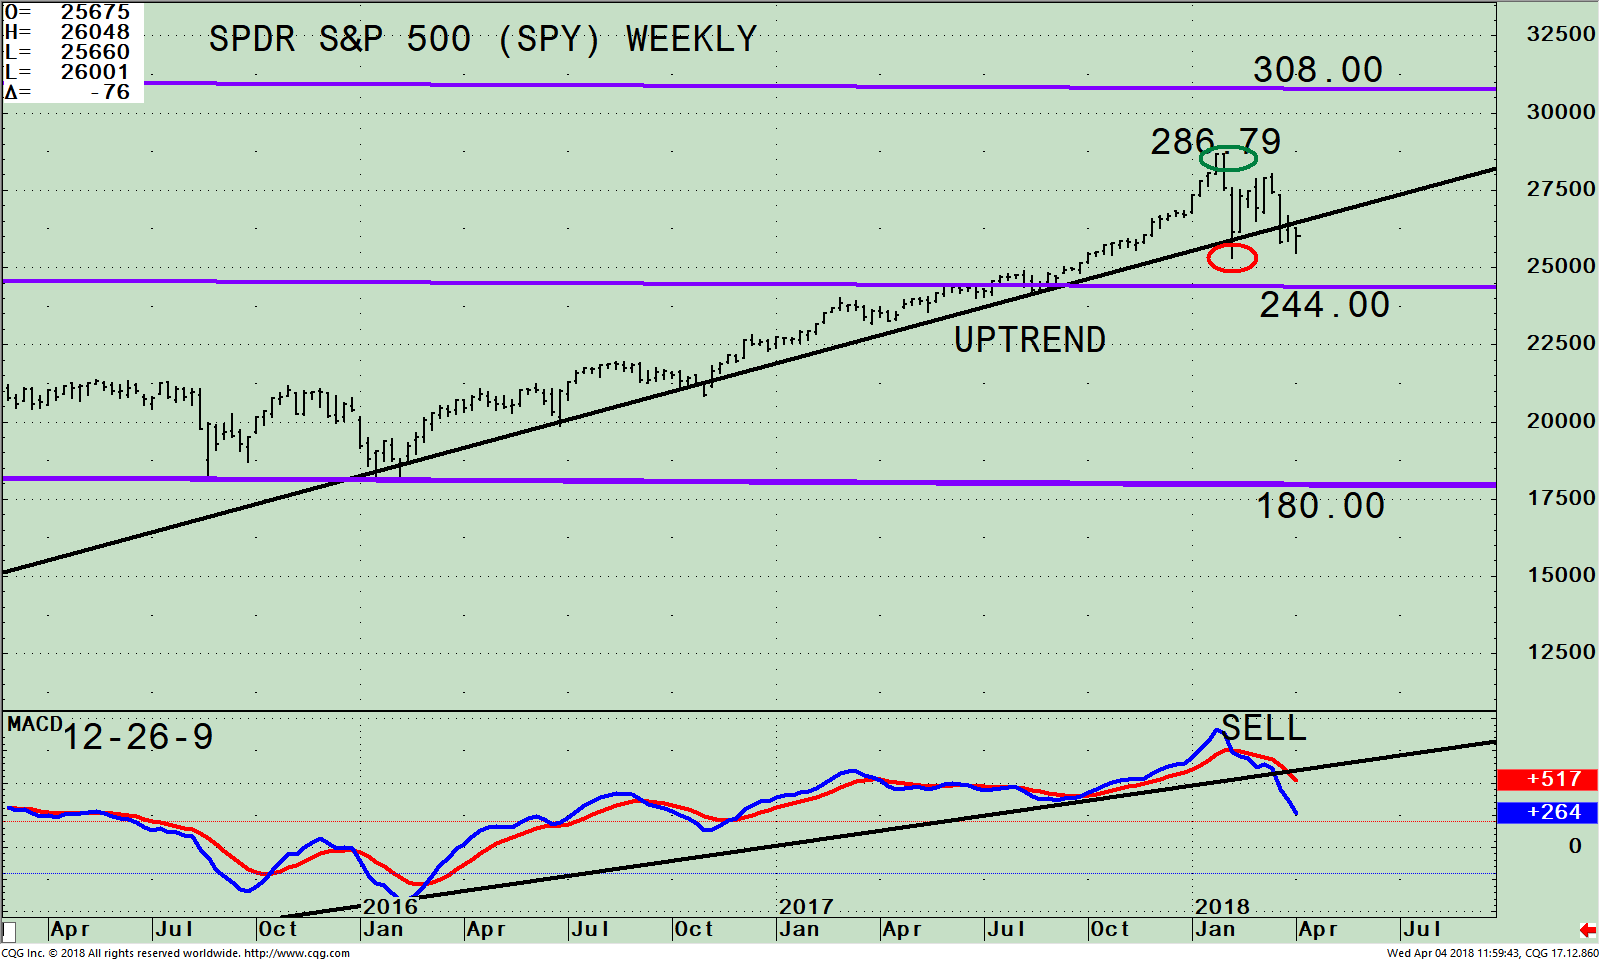
The chart above is the weekly SPDR S&P 500 (SPY) ETF and its weekly (intermediate) price channel (purple lines). The S&P 500 (SPY) is made up of 500 stocks of the largest companies in the U.S. When you invest in the S&P 500 (SPY), you are getting a broad representation of large-cap U.S stocks with moderate risk.
The SPY is below its uptrend line. The S&P 500 (SPY) wasn’t strong enough to quite reach the upper channel objective at 308.00, peaking at 286.79 in January. As in the case of the Russell 2000 (IWM) during February’s decline, the two-year uptrend also was slightly penetrated, followed by a rally that failed to take out the high. Support is at 244.00 and resistance is at 262.00.
MACD (lower chart) is on a sell. The MACD up trendline from January 2016 is no longer in effect.
Summing Up:
It’s too early to say that the top has been seen or if a short-term bottom is close at hand, based on the very oversold short-term condition and investor appetite for bargain hunting. Upside momentum is undoubtedly diminishing. There is no implication that downside momentum is complete. Chart patterns of the Russell 2000 (IWM) and the S&P 500 (SPY) imply the intermediate and daily trends are no longer supporting the bulls, and its evident risk has increased. Therefore, it would be safer to wait to add to your investments if you have cash. On the other hand, if the market rises, reduce some of your aggressive holdings on any strength over the next several weeks.
I would love to hear from you. Please call me at 516-829-6444 or email at bgortler@signalert.com to share your thoughts or ask me any questions you might have.
Sign up for a FREE 3 issue trial of
SYSTEMS AND FORECASTS Click HERE
******Article published by Bonnie Gortler in Systems and Forecasts April 4, 2018
Disclaimer: Although the information is made with a sincere effort for accuracy, it is not guaranteed that the information provided is a statement of fact. Nor can we guarantee the results of following any of the recommendations made herein. Readers are encouraged to meet with their own advisors to consider the suitability of investments for their own particular situations and for determination of their own risk levels. Past performance does not guarantee any future results.


Create more wealth in your life
with these simple strategies.
As an added bonus you will also
receive BG’s Updates and Ezine

Discover how to quickly create more well-being in your life with these simple strategies.
As an added bonus you will also
receive BG’s Updates and Ezine

As an added bonus you will receive BG’s Updates and Ezine

All work listed on BonnieGortler.com is licensed under a Creative Commons Attribution - Noncommercial - No Derivative Works 3.0 Unported License.


Free Report:
Grow and Sustain Your Wealth
Discover how to grow your money with these easy, simple steps.

