

10 Simple Tips for Financial Well-Being
07/01/2026
The long-term trend of the market remains up and this month stocks are rising despite higher interest rates and trade war concerns. However, a possible correction could occur sooner rather than later if near-term short-term support levels are broken. Some disturbing patterns are emerging which could become troublesome if the market starts to soften. On the other hand, if stocks can hold their ground, which our models suggest is likely, then we can continue to ride out the ups and downs while awaiting a more bullish market climate later in the year.
Small and mid-cap sectors should provide the clues to help know if the advance will stall in July and August or if the advance will continue. Keep an eye on midcaps if they can regain strength compared to S&P 500.
Where do we go from here?
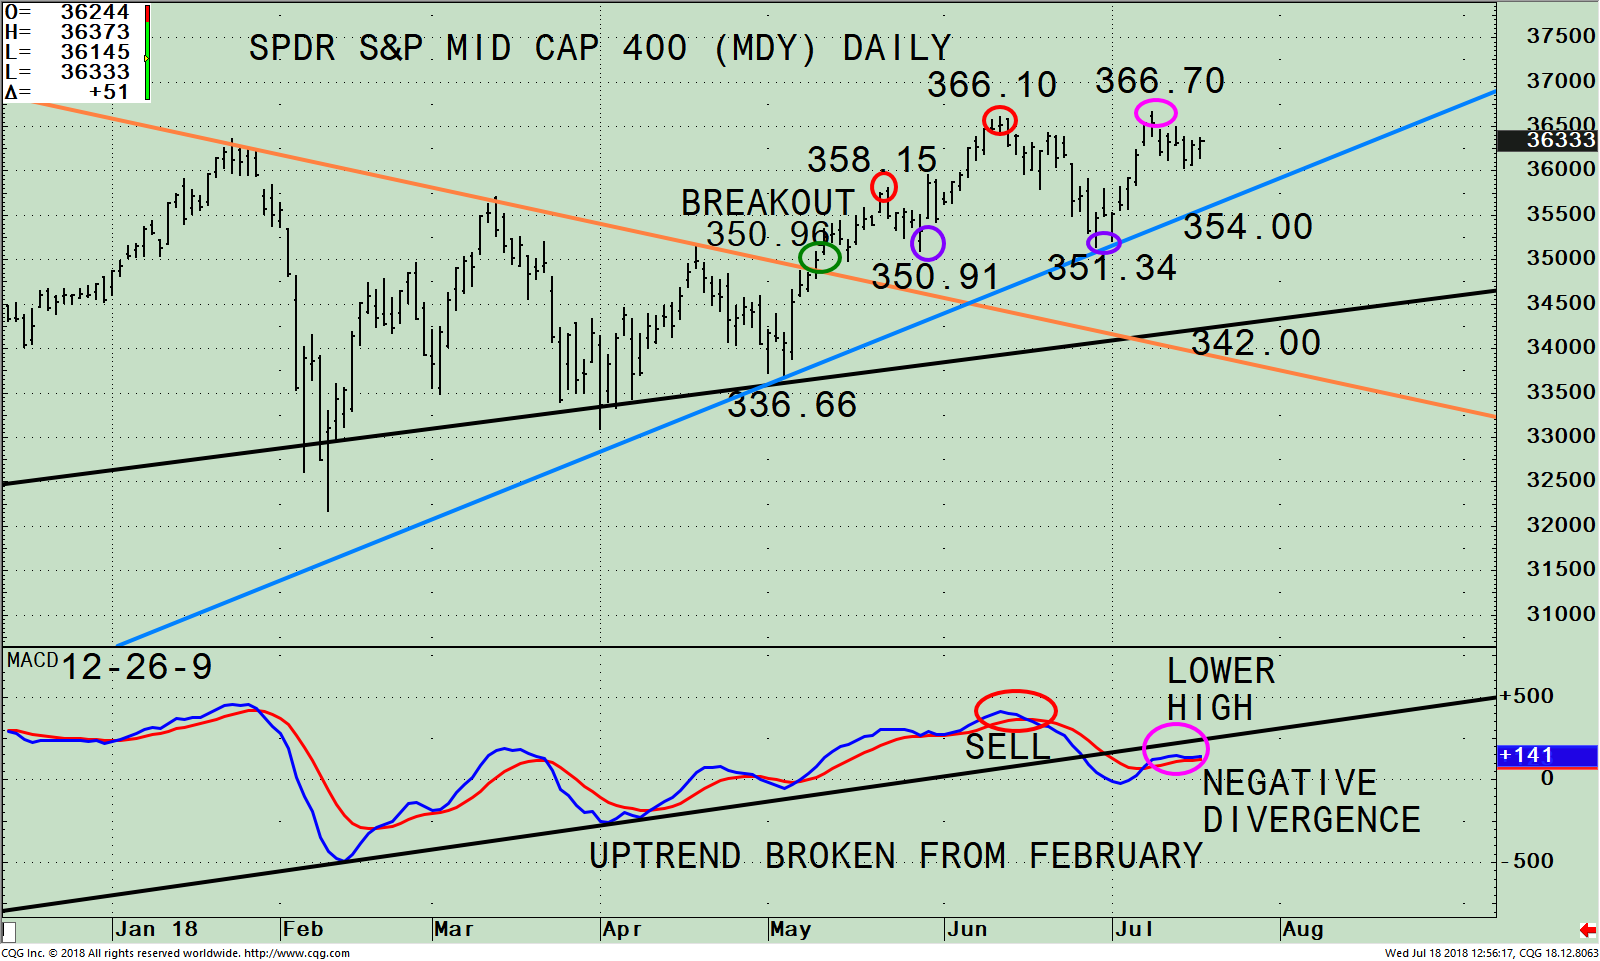
Figure: The SPDR S&P Mid Cap 400 (MDY) DAILY
The chart above is the daily SPDR S&P Mid Cap 400 Index Trust ETF (MDY), that tracks a market-cap weighted index of mid cap U.S. companies made up of 400 stocks in a broad mix of major industry groups, without either a growth or value bias. As of 7/16/18, the top 5 sectors in the S&P Mid-Cap 400 Index are Technology 16%, Financials 16%, Industrials 14.00%, Consumer Cyclicals 13% and Real Estate 9% totaling 70.00 %. Source: http://etfdb.com/etf/MDY/).
The top part of the chart shows the MDY broke out of its downtrend from 1/24/18 on May 19 at 350.96 (green circle). The MDY rose to 358.15 before a short decline occurred to test the breakout at 350.91 (purple circle). After the successful test, the MDY rallied to 366.10 before stalling and then retracing the breakout yet again falling to 351.34 (purple circle), and then rising to 366.70 (pink circle). Through the up and downs in recent weeks, the uptrend line from May 3rd (blue line) is key. There has been some indecision amongst traders over the uncertainties of a possibility of a trade war and the upcoming company earnings reports. Short term support is at 354.00 followed by 351.00 and 342.00. A break below 342.00 on a closing basis for 2 days could suggest a more meaningful decline is likely.
The bottom half of the chart shows MACD, a measure of momentum. MACD gave a sell (red circle) in June but at that time MACD confirmed the price high so therefore another rally attempt was likely. The MDY did rally to a new high but was unable to sustain a powerful advance, causing MACD to give a clear warning that momentum is waning forming a negative divergence (pink circle). MDY at a new high, but MACD not confirming the price high is troublesome, suggesting weakness is possible.
Although a negative MACD divergence is often bearish, not every negative divergence precedes a correction. MDY could still remain strong enough to pull its MACD above its level at “lower high” in the chart. In that case, the bearish implications of the negative divergence would be cancelled.
The weekly chart of MDY (below) tells a similar story to the daily chart: A negative divergence between MDY price and its 12-26 week MACD appears likely. (However, unlike the case with the daily chart, the weekly chart has not yet formed a negative divergence.) Notice that weekly MACD remains well above zero, in contrast to the daily MACD that has already touched negative territory. This reflects the longer-term uptrend in MDY that remains intact, with MDY still near its all-time price high. If you are looking for a long-term buying opportunity in MDY you would have to wait a while for the weekly MACD to get below zero.
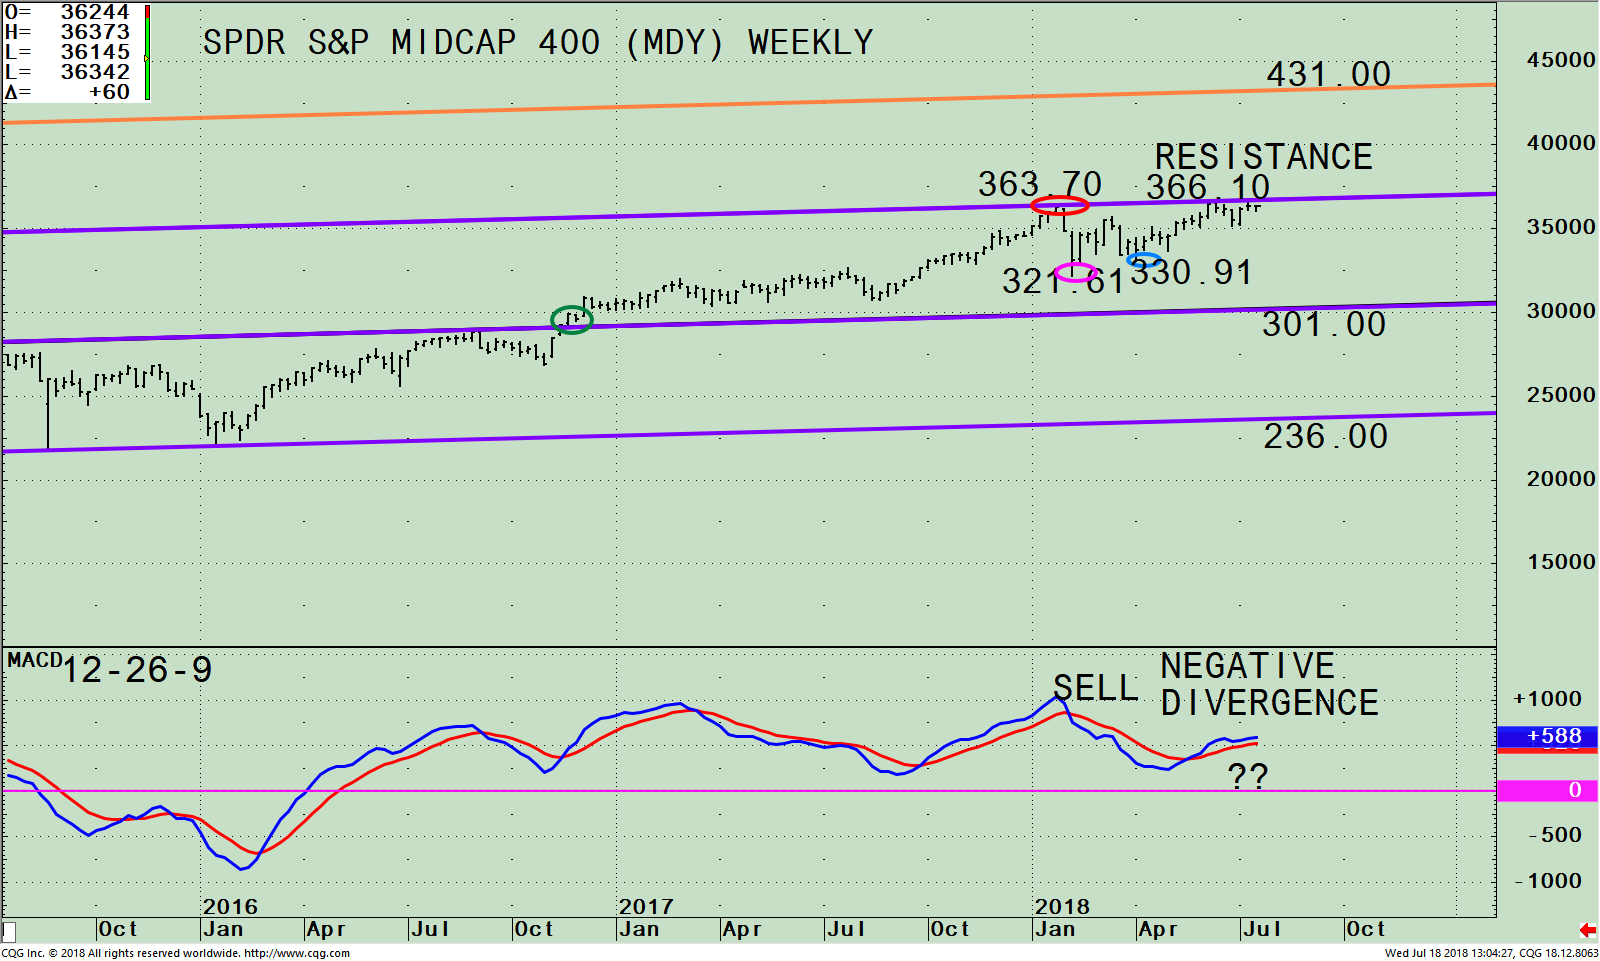
Figure: The SPDR S&P Mid Cap 400 (MDY) Weekly
The chart above is the SPDR S&P Mid-Cap 400 Index ETF (MDY) weekly channel (purple lines) and the upside potential channel objective at 431.00 (orange line), if the MDY can get through resistance and breaks out. The MDY broke out above the mid-channel in November 2016 (green circle). The MDY made a high of 363.70 on 1/24 hitting the upper channel objective. The MDY then fell 11.7%, to a low of 321.61 on 2/5. The MDY stabilized within the channel and made a slightly higher high of 366.10 on 6/10. Last week the MDY hit 366.71 and then stalled again. As of this writing, there is no breakout.
Figure: Weekly SPDR S&P Mid Cap 400 (MDY)/ S&P 500 (SPY) Index Ratio (Top) 12-26-9 MACD of MDY/SPY Ratio (Bottom)
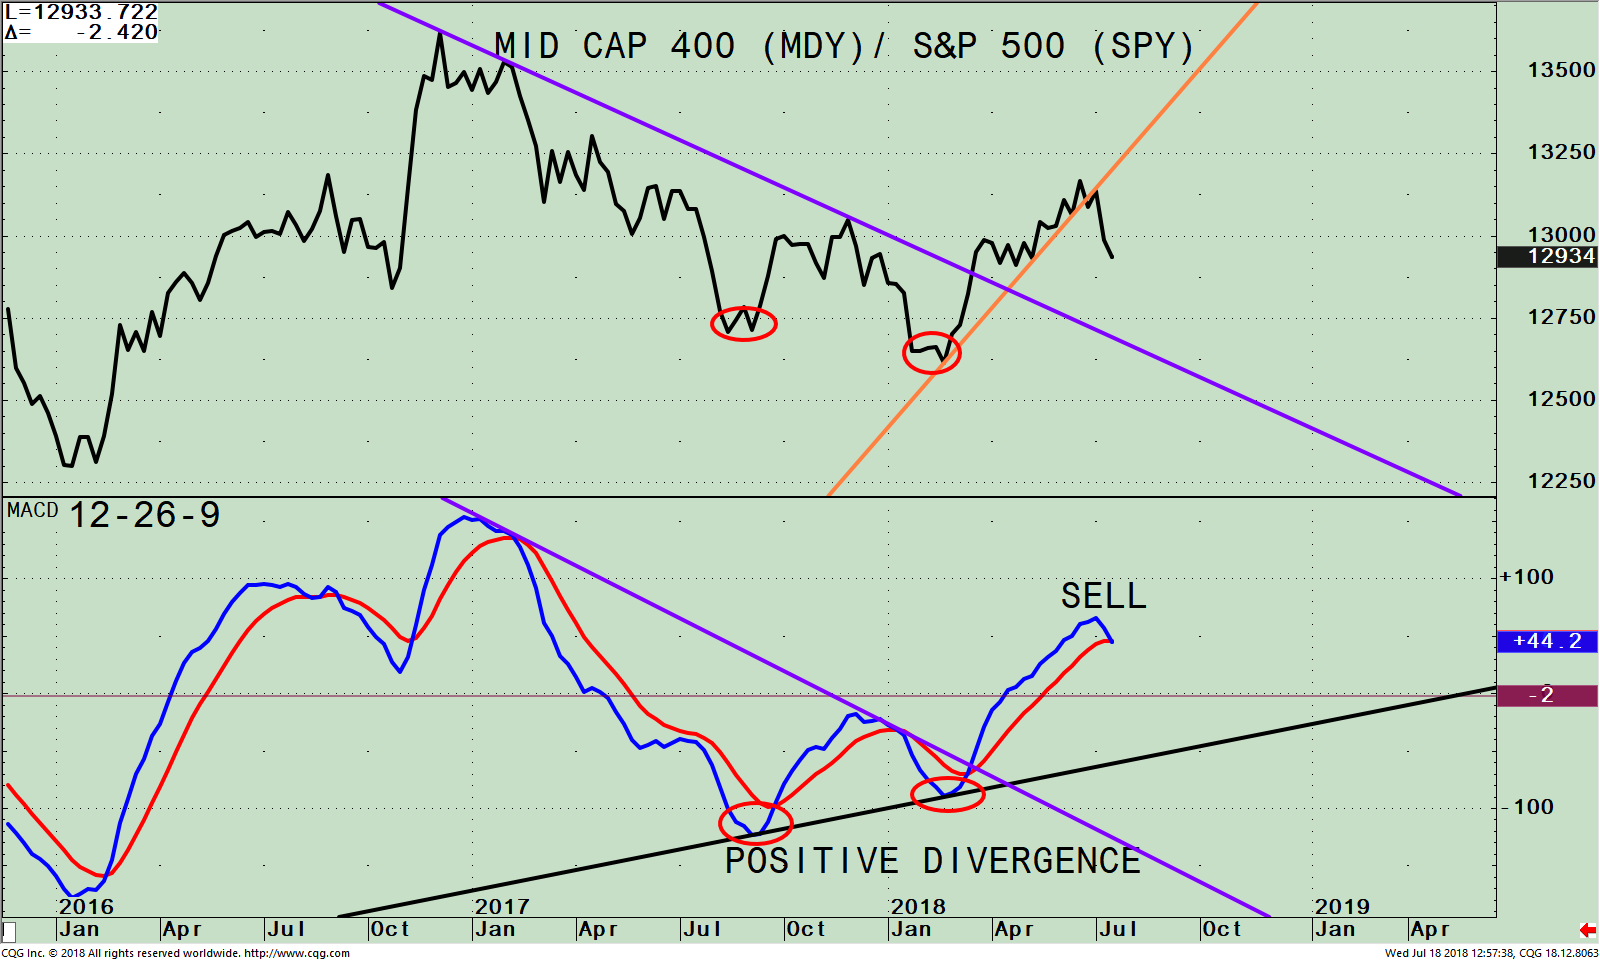
The top part of the chart is the weekly SPDR S&P Mid Cap 400 / S&P 500 Index Ratio (MDY/SPY). The MDY/SPY ratio peaked on 12/5/16. A rising line means the MDY is stronger, and if falling, the SPY is stronger. In January 2018 the MDY/SPY ratio broke the downtrend from December 2016 (purple line) and mid-caps came to life. The ratio is no longer rising and has also broken the uptrend. This indicates a change of leadership that the S&P 500 is now stronger.
The lower portion of the chart is MACD of MDY/ SPY. A sell has been generated confirming a change of leadership from MDY to SPY. Not only is momentum decreasing, but at the same time, the MDY/SPY relative strength ratio is also weakening, which suggests risk is higher now than earlier this year.
Summing Up:
The weakening momentum patterns do not bode well for the broad market. The MDY was leading in relative strength compared to the S&P 500 since January and there was no significant decline. The stock market continues to work its way higher. The MDY is not far from its all-time high of 366.71. If you are heavily weighted in MDY, now may be a good time to reduce your exposure and shift part of your assets to the SPY. If the MDY falls below 354.00 this would break the short-term uptrend and would suggest caution in the near term. On the other hand, if the MDY closes above 367.00 for two weeks, this would suggest the MDY is stronger than I expect and could imply a breakout with a potential rally to 431.00.
Wishing you and your family a happy, healthy summer filled with rest and relaxation.
Drop me a line! I’d love to hear from you. Please call me at 516-829-6444 or email at bgortler@signalert.com to share your thoughts or ask me any questions you might have
Sign up for a FREE 3 issue trial of
SYSTEMS AND FORECASTS Click HERE
******Article published in Systems and Forecasts by Bonnie Gortler July 18, 2018
Disclaimer: Although the information is made with a sincere effort for accuracy, it is not guaranteed that the information provided is a statement of fact. Nor can we guarantee the results of following any of the recommendations made herein. Readers are encouraged to meet with their own advisors to consider the suitability of investments for their own particular situations and for determination of their own risk levels. Past performance does not guarantee any future results.


Create more wealth in your life
with these simple strategies.
As an added bonus you will also
receive BG’s Updates and Ezine

Discover how to quickly create more well-being in your life with these simple strategies.
As an added bonus you will also
receive BG’s Updates and Ezine

As an added bonus you will receive BG’s Updates and Ezine

All work listed on BonnieGortler.com is licensed under a Creative Commons Attribution - Noncommercial - No Derivative Works 3.0 Unported License.


Free Report:
Grow and Sustain Your Wealth
Discover how to grow your money with these easy, simple steps.

