

10 Simple Tips for Financial Well-Being
07/01/2026
“Expect the best. Prepare for the worst. Capitalize on what comes.”
-Zig Ziglar
After a good start to 2018, the major averages have struggled to generate any real upside momentum. Each time a rally has occurred, overhead resistance prevails and the market stalls. However, during the declines, short-term support levels have held.
Figure: The iShares Russell 2000 Index (IWM) Daily Price Channel, 50-Day Simple Moving Average, 200-Day Simple Moving Average and 12-26-9 day MACD
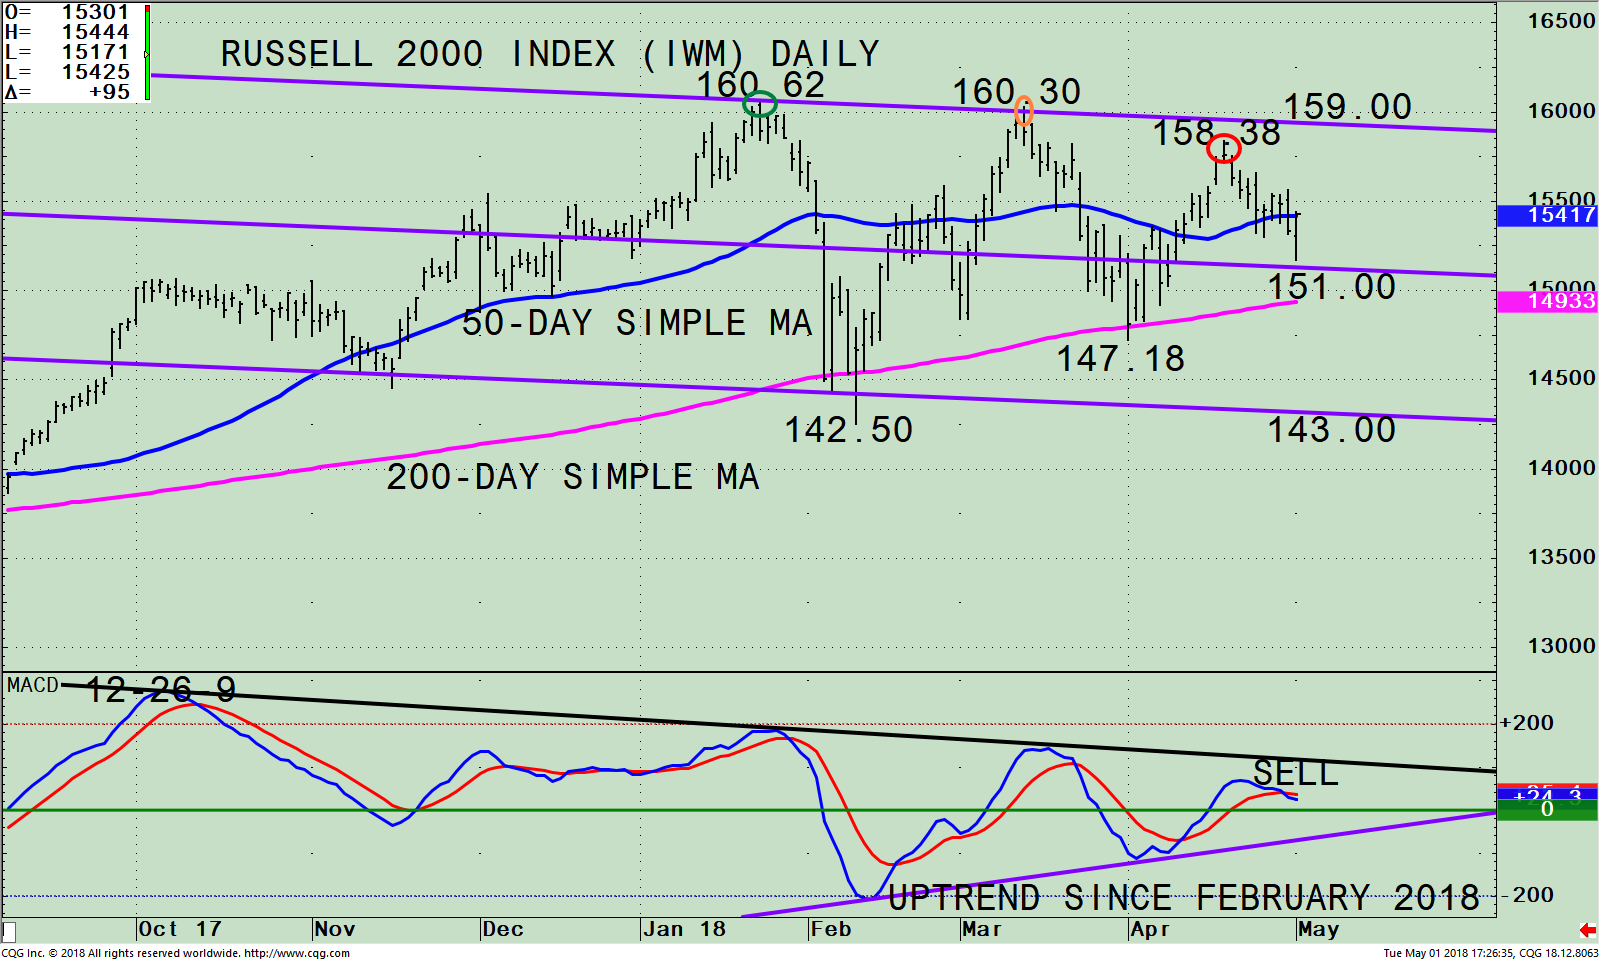
The top part of the chart is the iShares Russell 2000 Index (IWM) and its daily trading channel and the 50-day simple moving average (blue line) and the 200-day simple moving average (pink line). The iShares Russell 2000 Index ETF (IWM) is made up of companies with a market capitalization of between $300 million and $2 billion. The Russell 2000 (IWM) portfolio top sector holdings as of 4/30/18, is Financials 24.41%, Health Care 15.77%, Industrials 14.98%, Technology 14.82%, and Consumer Cyclicals 13.22 totaling 83.20%.
The Russell 2000 Index (IWM) peaked just under the channel objective of 158.38 on 4/18/18 (red circle) unable to get through the previous high at 160.30 (orange circle). The IWM then turned down hovering around the 50-day simple average (in blue) and falling below, before finding support slightly above the middle channel at 151.00 with a low of 150.71. The reversal on 5/1 to the upside is an encouraging that sign the short-term decline could be coming to an end and another rally toward the highs will begin. Overhead resistance is between 158.00 and 160.00. A close above 160.00 for two days would imply a possible rise to 167.00.
On the other hand, if the present rally stalls and the IWM closes below the middle channel at 151.00 for two days, the IWM will likely test the 200-day moving average presently at 149.33. If the IWM closes below, this would imply a decline to the lower channel at 143.00 just above the low on 2/9 at 142.50.
The lower portion of the chart is MACD, a technical indicator that measures momentum. MACD is on a sell, falling, almost below 0, an area where favorable rallies develop once downside momentum subsides. It’s positive that MACD remains in an uptrend from February. If MACD does turn up, a rising double bottom would be formed which would be a favorable sign for the IWM to move higher. On the other hand, if the MACD goes below the uptrend since February 2018, this would be a warning sign of weakness developing, implying more risk in the near term.
Summing Up
There appeared to be a short-term upside reversal in the Russell 2000 (IWM) on 5/1 where the IWM closed at 154.25. If the IWM can close for two days above overheard resistance between 158.00-160.00, this would indicate a rally to 167.00 on the IWM is possible and positive in the near term for the broad market. I remain optimistic higher prices lie ahead.
Drop me a line! I’d love to hear from you. Please call me at 516-829-6444 or email at bgortler@signalert.com to share your thoughts or ask me any questions you might have.
Sign up for a FREE 3 issue trial of
SYSTEMS AND FORECASTS Click HERE
******Article published in Systems and Forecasts by Bonnie Gortler May 2, 2018
Disclaimer: Although the information is made with a sincere effort for accuracy, it is not guaranteed that the information provided is a statement of fact. Nor can we guarantee the results of following any of the recommendations made herein. Readers are encouraged to meet with their own advisors to consider the suitability of investments for their own particular situations and for determination of their own risk levels. Past performance does not guarantee any future results.


Create more wealth in your life
with these simple strategies.
As an added bonus you will also
receive BG’s Updates and Ezine

Discover how to quickly create more well-being in your life with these simple strategies.
As an added bonus you will also
receive BG’s Updates and Ezine

As an added bonus you will receive BG’s Updates and Ezine

All work listed on BonnieGortler.com is licensed under a Creative Commons Attribution - Noncommercial - No Derivative Works 3.0 Unported License.


Free Report:
Grow and Sustain Your Wealth
Discover how to grow your money with these easy, simple steps.

