

10 Simple Tips for Financial Well-Being
07/01/2026
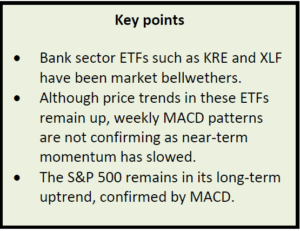 Despite the pull-back in February and March for stocks, the long-term trend remains up. The bulls are thriving again. Support levels have held as the major averages tested their lows several times in March and April. Sentiment readings have improved, no longer showing excessive optimism (contrary indicator) suggesting there is room for the market to rise in the near term. Daily momentum oscillators are in a favorable position to support a rally now. The major averages are beginning to show some signs of strength as well as improvement in market breadth. It’s a positive sign for the next few weeks the major averages have penetrated short term resistance levels intraday.
It’s not all good news though, intermediate momentum oscillators are not yet in an ideal buying area giving an all clear signal in many sectors. It’s not a healthy sign financials stocks have stalled, not participating in the present advance. This could be a warning the rally will be short lived. In the best case, they are slow to join the party and will resume their advance.
Watch the movement of Regional Banking and Financial Sector ETFs
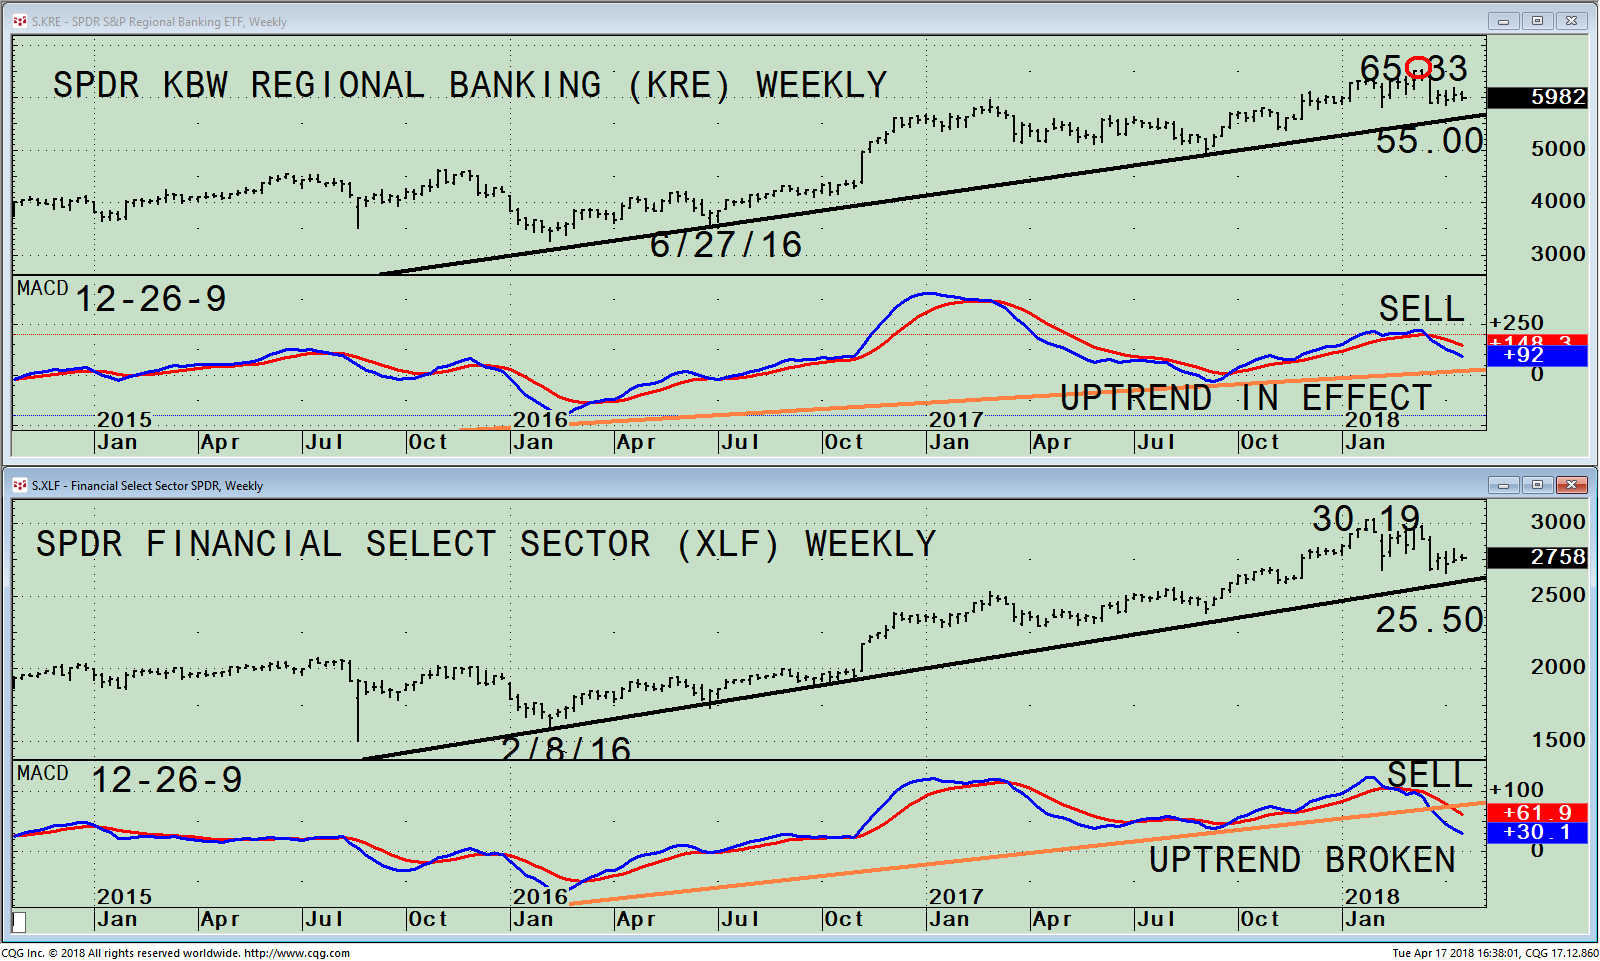
Figure: SPDR KBW Regional Banking (KRE) Weekly (Top) and SPDR Financial Select Sector (XLF) Lower Chart with MACD 12-26-9 (Bottom)
The top portion of the chart shows the weekly SPDR KBW Regional Banking (KRE) exchange-traded fund (ETF). KRE tracks an equally weighted index of common stocks in leading regional banks or thrifts (savings and loan associations). I like to watch KRE as an indicator to assess the strength of the market. Sometimes KRE can be very volatile. When the KRE is a leader it tends to be positive for the overall market. However, when KRE lags, I don’t expect a major advance to occur in the intermediate term.
If the KRE remains above 55.00, the intermediate uptrend stays intact and further gains are likely. If the KRE closes below, then this would be a warning sign of possible weakness ahead.
The lower portion of the top chart is MACD (12, 26, 9), a technical indicator that measures momentum. MACD remains on a sell and is not yet in oversold territory where safe entries develop. Regional Banks (KRE) MACD had a negative divergence where KRE made a price high in March 2018 compared to the high in January 2017 and then sold off. If KRE breaks the MACD uptrend this would be a warning that regional banks could undergo profit taking, and investors could rotate into another sector.
The top portion of the bottom chart is the SPDR Financial Select Sector (XLF). The XLF is one of the ten SPDR ETFs. The XLF includes companies from the following industries: diversified financial services; insurance; banks; capital markets; mortgage real estate investment trusts (REITs); thrifts & mortgage finance; and consumer finance. As of 4/16/18, the assets in the top ten holding account for 55%. The top 2 holdings are Berkshire Hathaway Inc B (BRK/B) 11.45%, and JPMorgan Chase & Co (JPM) 11.35%. If either of the two top holdings JPM or BRK/B become out of favor by investors selling their holdings, this would put downside pressure on the XLF. Both stocks BRK/B and JPM long term uptrends remain in effect. However, their intermediate (weekly) MACD patterns are like the pattern of the XLF, which is losing momentum and bears watching.
In Sum:
On the other hand, MACD remains on a sell with momentum still falling, not yet below 0 in a favorable position from which meaningful rallies develop. Regional Banking, the Financial Sector and the S&P 500 Indicate a Mostly Favorable OutlookThe MACD of XLF has already broken the uptrend for the intermediate trend. If KRE doesn’t turn up soon it’s MACD will also break the intermediate uptrend, which may reveal the advance in the financial sector is coming to an end.
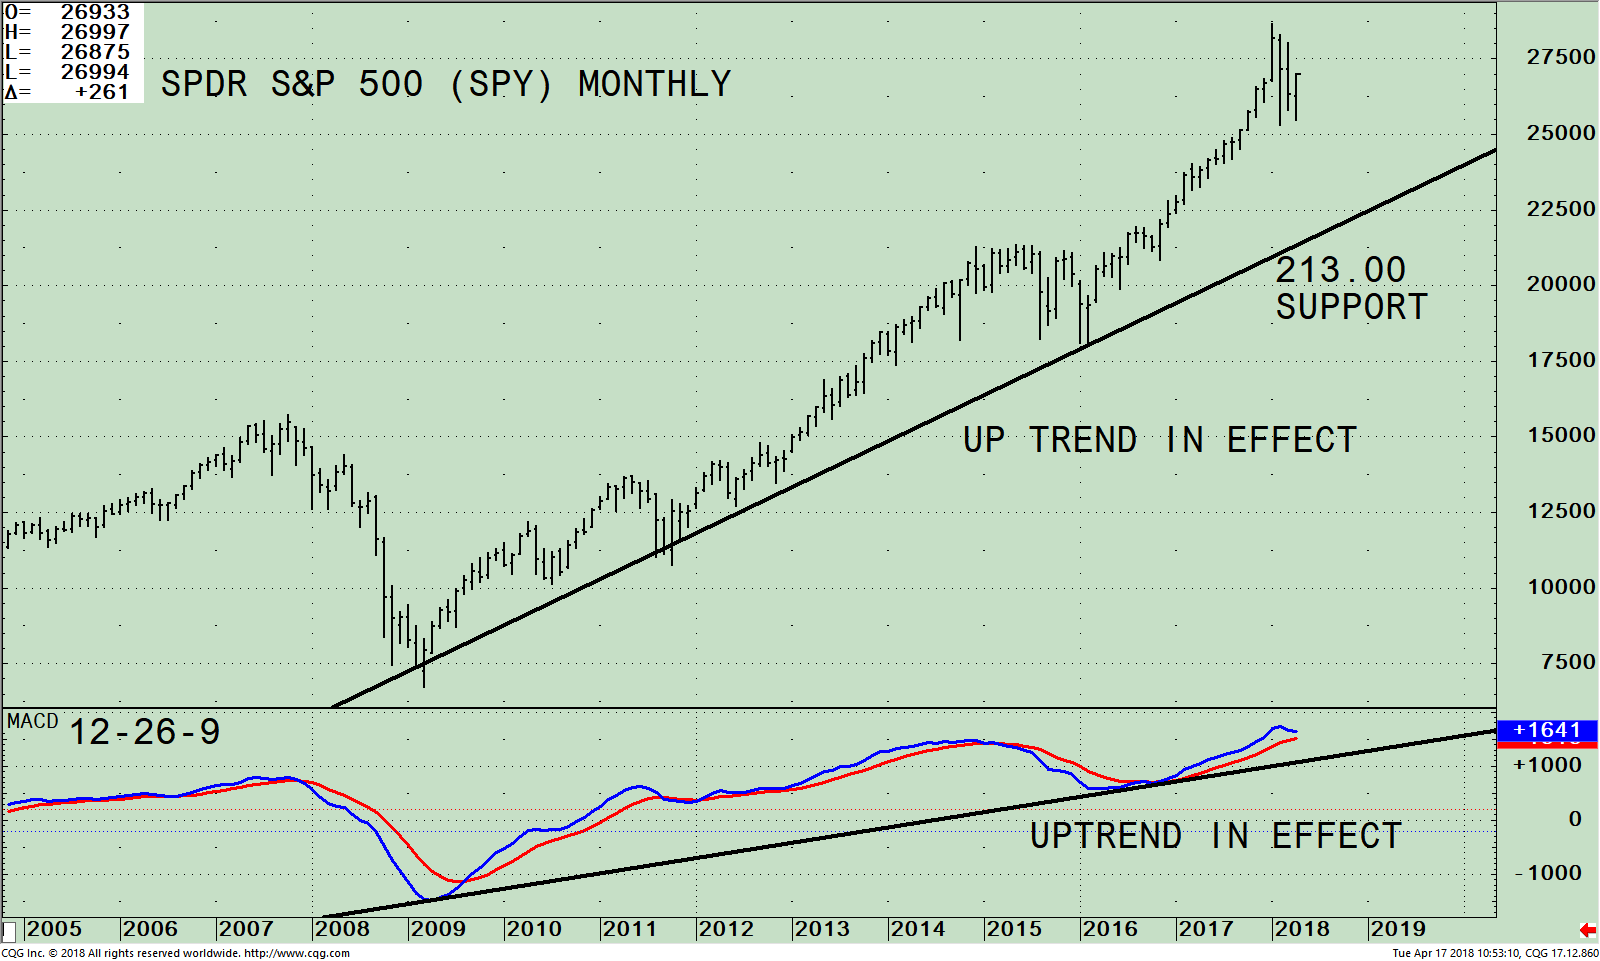
Figure: S&P 500 SPDR ETF Monthly Price (SPY, top) and MACD 12-26-9 (bottom)
The chart above is the monthly SPDR S&P 500 (SPY) that is made up of 500 stocks of the largest companies in the U.S. As of 4/17, the top 5 holdings in the S&P 500 were Apple Inc. (AAPL) 3.91%, Microsoft Corporation (MSFT) 3.16%, Amazon (AMZN) 2.53%, Facebook (FB) 1.74%, and Berkshire Hathaway Inc. B (BRK/B) totaling 11.34%. When you invest in the S&P 500 (SPY), you will get a diverse representation of the large-cap U.S. stock market.
The top part of the chart is the monthly (long-term) price of the SPDR S&P 500 (SPY). The SPY uptrend that began in 2009 (black line) remains in effect. Until this trend line is broken, any decline would be temporary and present buying opportunities along the way.
If the SPY falls below 213.00 this would turn the long-term trend negative. As time passes the level will rise. The bulls remain in control until proven otherwise.
The bottom half of the chart shows MACD, a momentum indicator. The monthly MACD confirmed the high made in the S&P 500 (SPY). This is positive. It also encouraging the MACD uptrend from 2009 is intact. It’s unlikely a decline now would be the end of the bull market with the long-term trend intact. The next decline in the S&P 500 (SPY) when it occurs of more than 5% will likely be a buying opportunity with at least one more rally attempt before a potential market top would be reached.
Summing Up:
The bull market still lives for now. The long-term trend on the S&P 500 (SPY) remains in effect if the SPY is above 213.00. The short, intermediate, and long-term trends are not all in alignment. The short term is the most favorable, while the intermediate is in question still having weakening momentum patterns. The long-term trend is not in jeopardy now. When they are all aligned this is the most favorable. Keep and eye on Regional Banking, the Financial Sector and the S&P 500 for what may be revealed.
Drop me a line! I’d love to hear from you. Please call me at 516-829-6444 or email at bgortler@signalert.com to share your thoughts or ask me any questions you might have.
Sign up for a FREE 3 issue trial of
SYSTEMS AND FORECASTS Click HERE
******Article published in Systems and Forecasts by Bonnie Gortler April 18, 2018
Disclaimer: Although the information is made with a sincere effort for accuracy, it is not guaranteed that the information provided is a statement of fact. Nor can we guarantee the results of following any of the recommendations made herein. Readers are encouraged to meet with their own advisors to consider the suitability of investments for their own particular situations and for determination of their own risk levels. Past performance does not guarantee any future results.


Create more wealth in your life
with these simple strategies.
As an added bonus you will also
receive BG’s Updates and Ezine

Discover how to quickly create more well-being in your life with these simple strategies.
As an added bonus you will also
receive BG’s Updates and Ezine

As an added bonus you will receive BG’s Updates and Ezine

All work listed on BonnieGortler.com is licensed under a Creative Commons Attribution - Noncommercial - No Derivative Works 3.0 Unported License.


Free Report:
Grow and Sustain Your Wealth
Discover how to grow your money with these easy, simple steps.

