

10 Simple Tips for Financial Well-Being
07/01/2026
Market Update 12/22/23
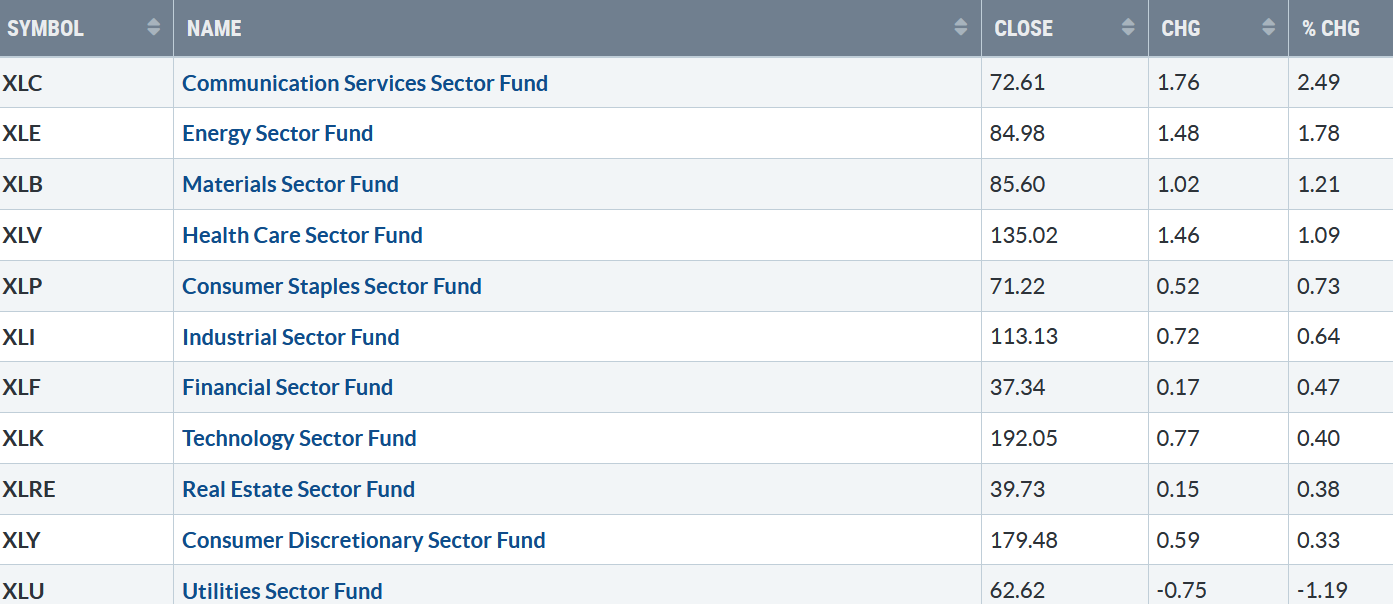
The impressive rally continues. Ten of eleven S&P SPDR sectors were higher last week. Communications Services (XLC) and Energy (XLE) were the best sectors, while Consumer Discretionary (XLY) and Utilities (XLU) were the weakest. The SPDR S&P 500 ETF Trust (SPY) gained +0.92%.
S&P SPDR Sector ETFs Performance Summary 12/15/23 – 12/22/23
Source: Stockcharts.com
122223 SPDR Sectors
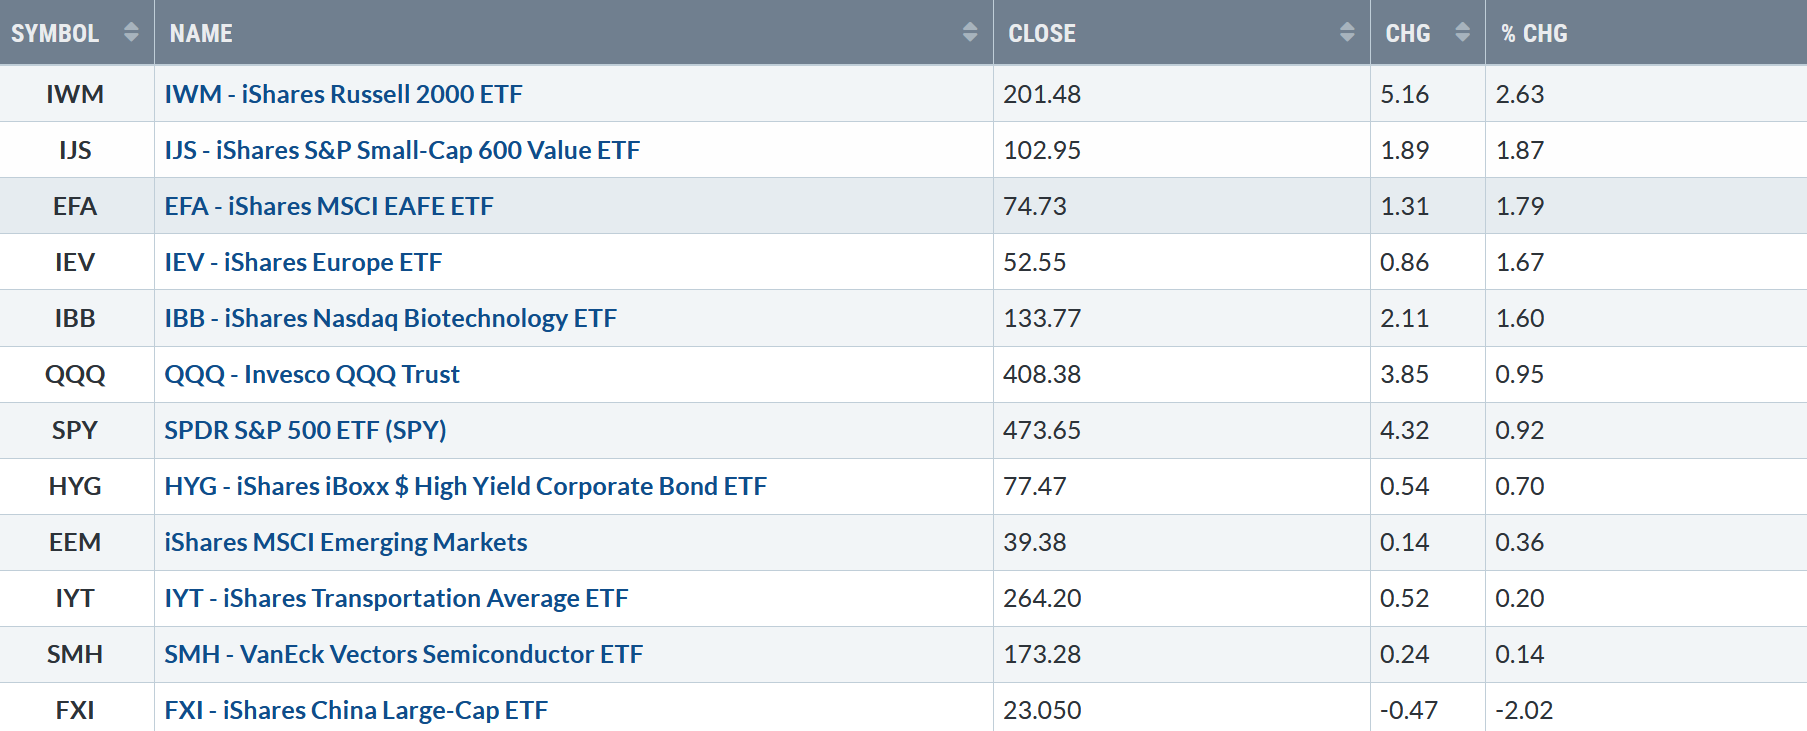
Figure 2: Bonnie’s ETFs Watch List Performance Summary 12/15/23 – 12/22/23
122223 Week ETFs
Source: Stockcharts.com
Small Cap Growth, Small Cap Value, and Internationals were leaders, not including China, which remains out of favor with investors. Semiconductors and Transports stalled.
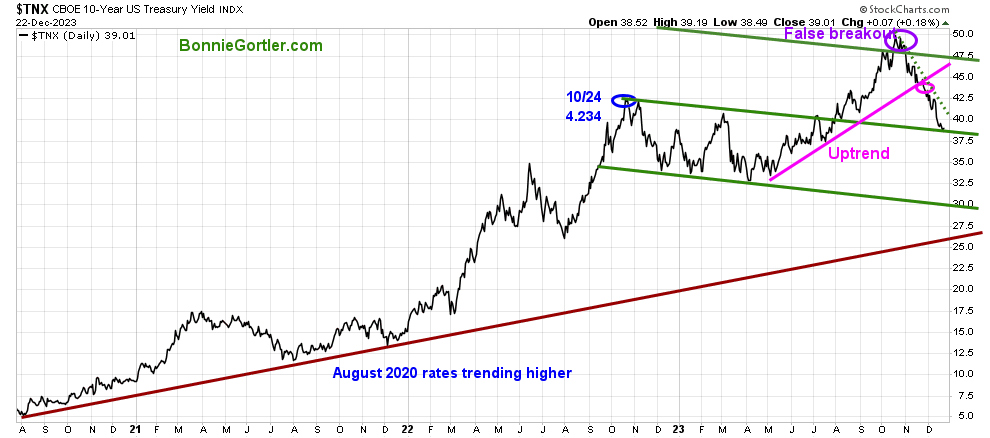
Figure 3: UST 10YR Bond Yields Daily
122223 UST 10 Yr Bond Yields Daily
Source: Stockcharts.com
The 10-year U.S. Treasury yields fell last week, closing at support at 3.901% (middle channel in green), remaining below the May uptrend (pink line) and in a downtrend (green dotted line) from October after the false break out. Falling yields will continue to be short-term positive for equities. A quick rise in yields would likely ignite a short, brief pullback.
The major market averages rose for the eighth week, with the Dow up + 0.22%, the S&P 500 up + 0.75% and the Nasdaq gaining +1.21%. The Russell 2000 Index led the advance, gaining +2.46%.
Are you interested in more knowledge about the stock market? Learn how to implement a powerful wealth-building mindset and simple, reliable strategies to help you grow your wealth in my eCourse Wealth Through Investing Made Simple. Learn more here.
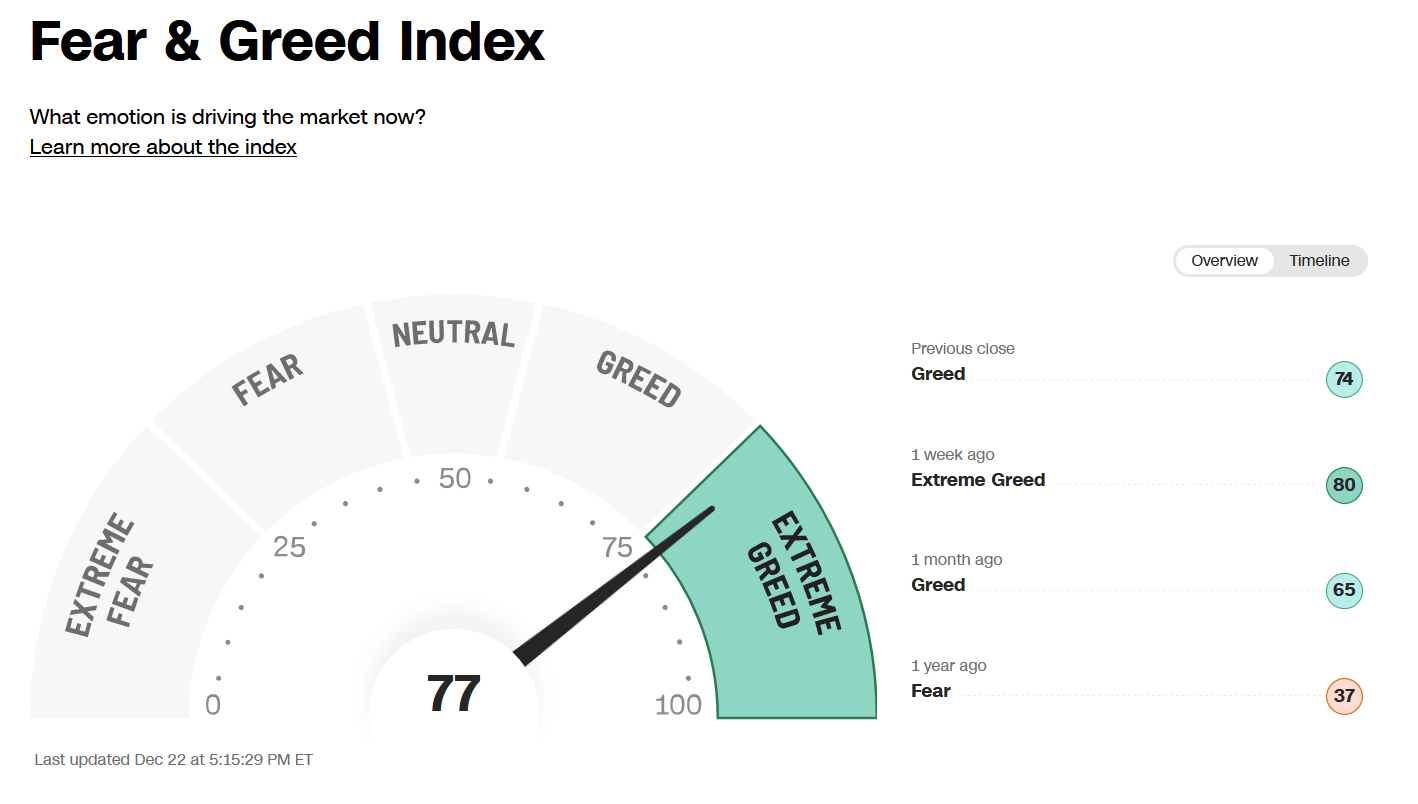
Figure 4: Fear & Greed Index
122223 CNN Fear and Greed Index
Source. CNN.com
Investor sentiment based on the Fear and Greed Index (a contrarian index) measures the market’s mood. VIX at 77 shows extreme greed, increasing the odds of a short-term pullback sooner rather than later with a more ideal safer buying opportunity in 2024.
Figure 5: Value Line Arithmetic Average
122223 VLE Daily
Source: Stockcharts.com
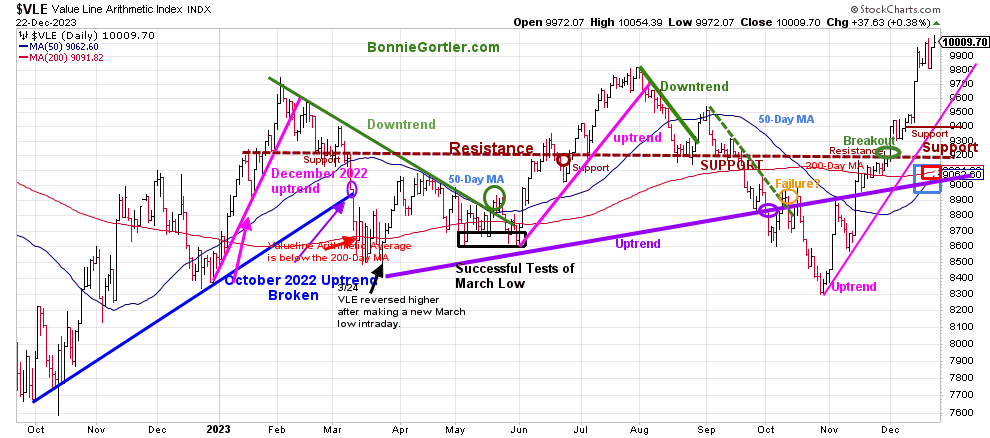
The Value Line Arithmetic Index ($VLE) is a mix of approximately 1700 stocks. VLE broke the October 2022 uptrend in early March 2023 (blue line), and April, May, and June successfully tested the March low and ultimately made a new low in October 2023.
The daily trend of VLE remains up. VLE closed at 10009.7, up +1.61% last week, remaining above the August high. VLE remains above the 50-day MA, which is rising (blue rectangle), and the 200-day MA (red rectangle), a sign of underlying strength.
Support is 9800, 9400, 9200, and 9000. Resistance is at 10200.
It would remain positive if VLE holds support at 9800 and then turns up, surpassing this week’s high of 10054.39.
Do you want to go deeper into charting? Learn more in the comfort of your home today with my Free 33-minute Training, Charting Strategies to Cut Risk and Trade with the Trend. Sign up here.
Market breadth is favorable.
Weekly market breadth was positive on the New York Stock Exchange Index (NYSE) and the Nasdaq. The NYSE had 2007 advances and 930 declines, with 403 new highs and 49 new lows. There were 3046 advances and 1638 declines on the Nasdaq, with 653 new highs and 316 new lows.
If you want to go more in-depth with charts, I invite you to join my Free Facebook group, Wealth Through Market Charts.
Figure 6: Daily New York Stock Exchange (NYSE) New Lows
122223 NYSE New Lows Daily
Source: Stockcharts.com
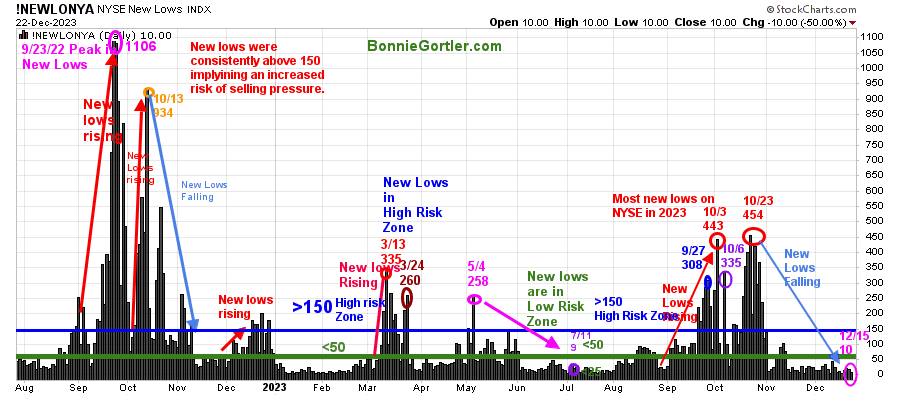
Watching New Lows on the New York Stock Exchange is a simple technical tool that helps awareness of the immediate trend’s direction. New lows warned of a potential sharp pullback, high volatility, and “panic selling” for most of 2022, closing above 150. The peak reading was 9/23/22 when New Lows made a new high of 1106 (pink circle), and New Lows expanded to their highest level in 2023 on 3/13/23 (red circle) to 335.
New Lows increased in September (red arrow on the right) toward the high-risk zone greater than 150, peaking at 443 on 10/3, the highest reading since October 2022.
New lows had stopped accelerating in early October. However, the decline was not complete until the end of the month as New Lows made only a slight new high, peaking at 454 (red circle) on 10/23.
Last week, New lows on the NYSE closed at 10 (pink circle), remaining in the lowest risk zone below 25. It would remain positive and imply low risk if New Lows stay between 25 and 50. On the other hand, an increase above 150 would be a warning sign of a market correction. However, New Lows will take at least a few weeks to expand to greater than 150 due to the rally’s strength.
Learn more about the significance of New Lows in my book, Journey to Wealth, published on Amazon. If you would like a preview, get a free chapter here.
Small Caps remain strong.
Figure 7: Daily iShares Russell 2000 (IWM) Price (Top) and 12-26-9 MACD (Middle and Money Flow (Bottom)
122223 IWM Daily
Source: Stockcharts.com
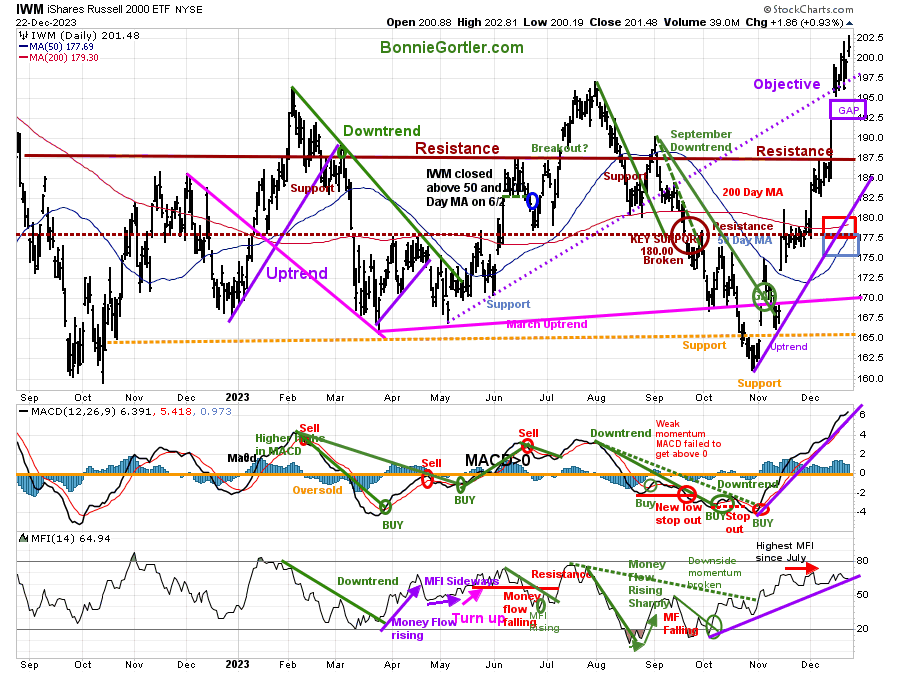
The top chart is the daily iShares Russell 2000 Index ETF (IWM), the benchmark for small-cap stocks, with a 50-Day Moving Average (MA) (blue line) and 200-Day Moving Average (MA) (red line) that traders watch and use to define trends.
IWM rose, closing at 201.48, up +2.63% last week, closing well above the 50-day MA and the 200-day MA (blue rectangle).
Support is at 197.00, 193.00, 187.50, and 177.50. Resistance is at 210.00. (based on the monthly chart not shown)
MACD (middle chart) remains on a buy, above 0, the year’s highest reading, implying underlying strength and the likelihood another rally will follow any pullback.
Money Flow (lower chart) peaked in November after reaching its highest level since July. The uptrend remains (purple line) now, but it is in jeopardy of being broken unless MFI turns up.
Keep an eye on the Russell 2000 (IWM). It would be positive if IWM remains stronger than the S&P 500. However, if IWM starts to lag, it would be a clue that a retracement or consolidation after the recent sharp gains could begin.
Figure 8: Daily Semiconductors (SMH) (Top) and 12-26-9 MACD (Middle) and Money Flow (Bottom)
122223 SMH Daily
Source: Stockcharts.com
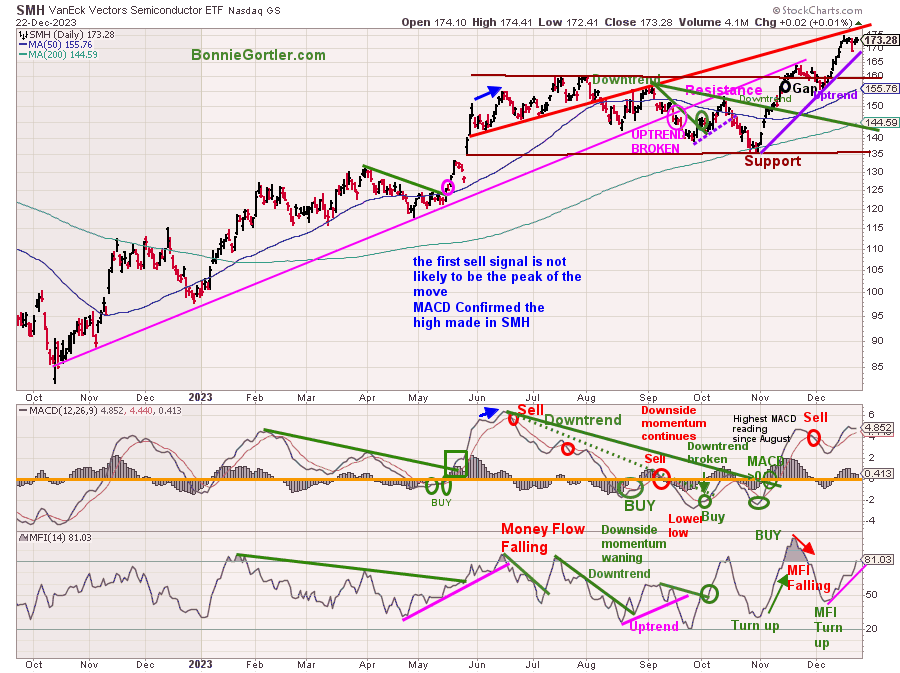
The top chart shows the Daily Semiconductors (SMH) ETF, which is concentrated mainly in US-based Mega-Cap Semiconductors companies. SMH tends to be a lead indicator for the market when investors are willing to take on increased risk and the opposite when the market is falling.
The Semiconductor ETF (SMH) gained +0.14% last week, closing at 173.28. The short-term objective remains 185.00. Support is at 165.00, 155.00, 145.00, and 135.00. Resistance is at last week’s high 174.41 (note ex-dividend on 12/18/23). The Short-term objective remains 185.00.
MACD (middle chart) is on a sell, rising above 0, a potential double top when MACD weakens.
Money Flow (lower chart) is rising, in an uptrend, but did not surpass the previous high. A turndown would imply investors moving away from Semiconductor stocks and cutting back on risk.
For the latest Bonnie’s charts, visit https://www.bonniegortler.com/marketcharts/
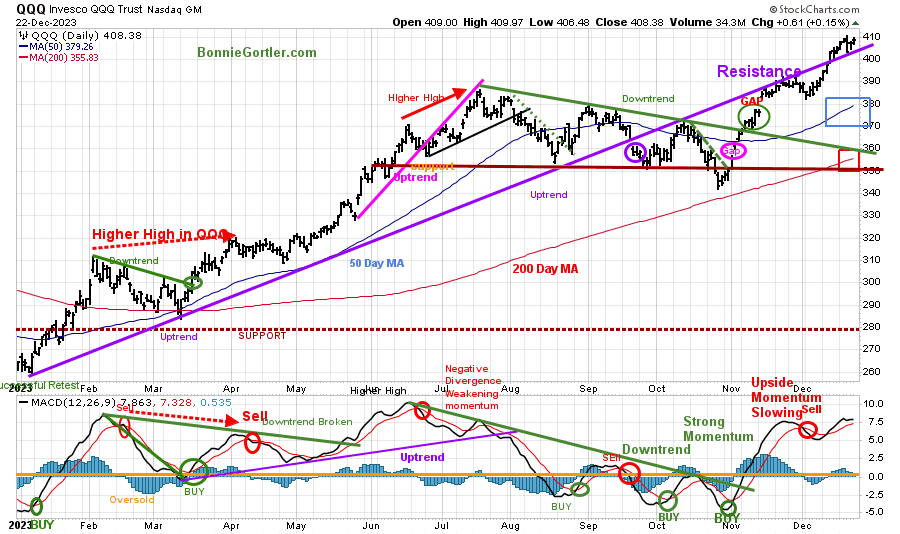
Figure 9: Daily Invesco QQQ Trust (QQQ) Price (Top) and 12-26-9 MACD (Bottom)
122223 QQQ Daily
Source: Stockcharts.com
The chart shows the daily Invesco QQQ, an exchange-traded fund based on the Nasdaq 100 Index. QQQ made a low in October 2022 (red circle), followed by a successful retest of the low in early January 2023 and the start of an uptrend.
Last week, Nasdaq 100 (QQQ) closed above resistance at 406.50, up +0.95%, closing at 408.38. QQQ remains above the 50-day Moving Average (blue rectangle) and the 200-day Moving Average (red rectangle), a sign of underlying strength.
Support is 400.00, 390.00, 380.00, 360.00, and 350.00, with resistance at 406.50.
The bottom chart, MACD (12, 26, 9), is on a sell, above 0. A turndown high would be a short-term negative.
Be alert to increased volatility into the New Year, as investors waiting for the end of 2023 to take profits will likely do so in the first week of January.
Are you interested in more knowledge about the stock market? Learn how to implement a powerful wealth-building mindset and simple, reliable strategies to help you grow your wealth in my eCourse Wealth Through Investing Made Simple. Learn more here.
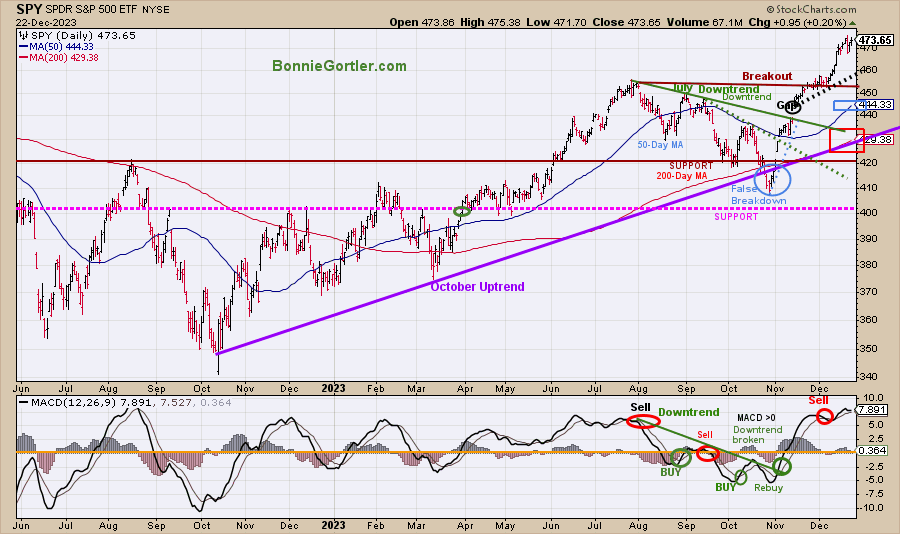
Figure 10: The S&P 500 Index (SPY) Daily (Top) and 12-26-9 MACD (Bottom)
122223 SPY Daily
Source: Stockcharts.com
The S&P 500 (SPY) had a false breakdown (blue circle) in October after being in an uptrend (purple line). Two downtrends were in effect and broken to the upside in September (green dotted line) and August (green solid line).
The daily trend remains up.
The SPY closed at 473.65, up +0.92% for the week, remaining above the 50-day Moving Average (blue rectangle) and the 200-day Moving Average (red rectangle), a sign of strength.
Support is at 460.00, 455.00, 444.00, 430.00, 420.00. It’s encouraging SPY remains above 455.00, where it broke out (brown horizontal line).
MACD (bottom chart) remains on a sell but is close to a repeat sell if SPY weakens.
A higher objective of 485.00 remains for the SPY. It would be positive if SPY remains above 471.00 on Tuesday and stays above last week’s low of 467.82. With short-term momentum extended, the risk of a pullback increases.
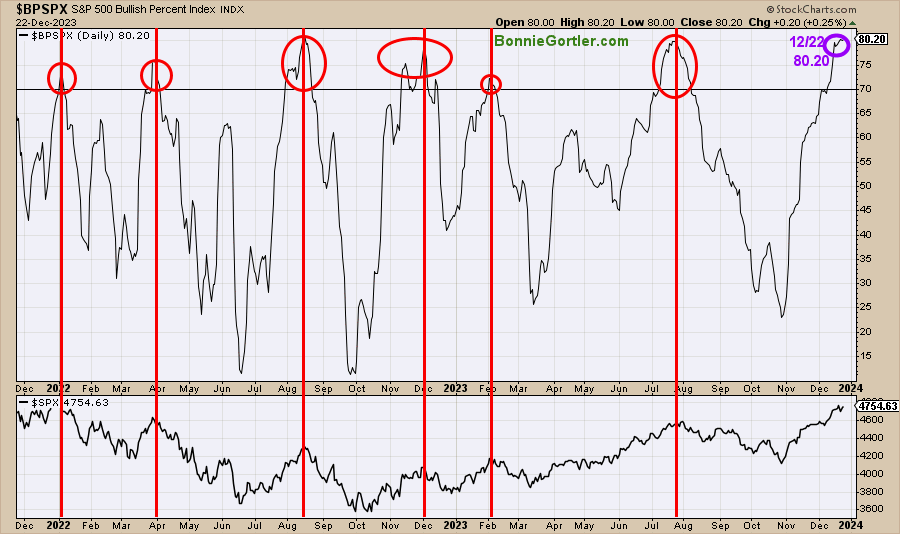
Figure 11: S&P 500 Bullish Percent Index
122223 SPY Bullish Percentage Index Daily
Source: Stockcharts.com
The Bullish Percent Index (BPI), developed by Abe Cohen in the 1950s, is a breadth indicator based on the number of stocks based on Point and Figure Buy signals. The indicator helps you know the market’s health and when it’s overbought or oversold.
When the bullish percent index is above 70%, the market is overbought, and when the indicator is below 30%, the market is oversold. Like other overbought indicators, sometimes it does not get as high or as low.
In 2022 and 2023, the indicator reached 70 (overbought) six times (red circles). All occurrences were near market peaks (red lines). Last week, the BPI rose, closing at 80.22 (purple circle). A reading over 70, followed by a retracement below 70, would give a sell signal on this indicator. (Note the decline this midweek on the sell-off did not come close to bringing the indicator below 70.00.
Summing Up:
The bulls have been in control for the past eight weeks. The tape remains positive, giving higher objectives with the major averages in an uptrend. Small-cap stocks are leading the advance after lagging early in 2023. Expect an increase in volatility and be alert for a possible brief pullback with short-term momentum indicators extended if there is a quick rise in yields or investors and institutions decide it’s time to lock in profits.
Remember to manage your risk, and your wealth will grow.
Let’s talk investing. You are invited to set up your Free 30-minute Wealth and Well-Being Strategy session by clicking here or emailing me at Bonnie@BonnieGortler.com. I would love to schedule a call and connect with you.
Disclaimer: Although the information is made with a sincere effort for accuracy, it is not guaranteed that the information provided is a statement of fact. Nor can we guarantee the results of following any of the recommendations made herein. Readers are encouraged to meet with their own advisors to consider the suitability of investments for their own particular situations and for determination of their own risk levels. Past performance does not guarantee any future results.


Create more wealth in your life
with these simple strategies.
As an added bonus you will also
receive BG’s Updates and Ezine

Discover how to quickly create more well-being in your life with these simple strategies.
As an added bonus you will also
receive BG’s Updates and Ezine

As an added bonus you will receive BG’s Updates and Ezine

All work listed on BonnieGortler.com is licensed under a Creative Commons Attribution - Noncommercial - No Derivative Works 3.0 Unported License.


Free Report:
Grow and Sustain Your Wealth
Discover how to grow your money with these easy, simple steps.

