

10 Simple Tips for Financial Well-Being
07/01/2026
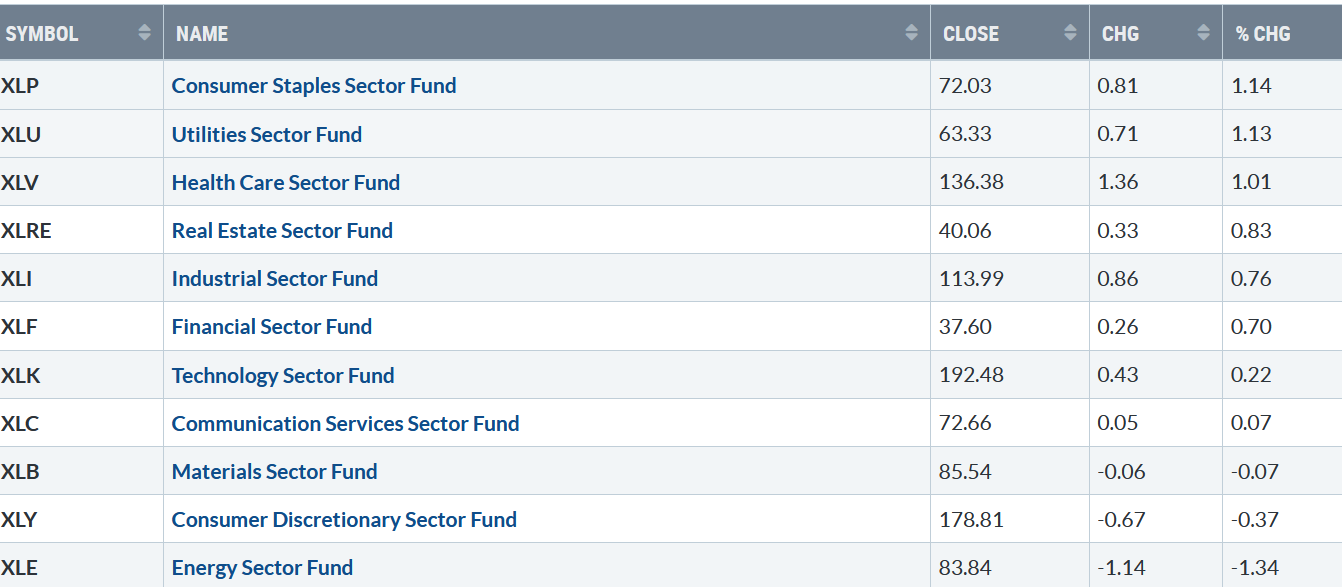
A spectacular 2023. Eight of eleven S&P SPDR sectors were higher last week. Consumer Staples (XLP) and Utilities (XLU) were the best sectors, while Consumer Discretionary (XLY) and Energy (XLE) were the weakest. The SPDR S&P 500 ETF Trust (SPY) gained +0.92%.
S&P SPDR Sector ETFs Performance Summary 12/26/23 – 12/29/23
122923 SPDR Sectors
Source: Stockcharts.com
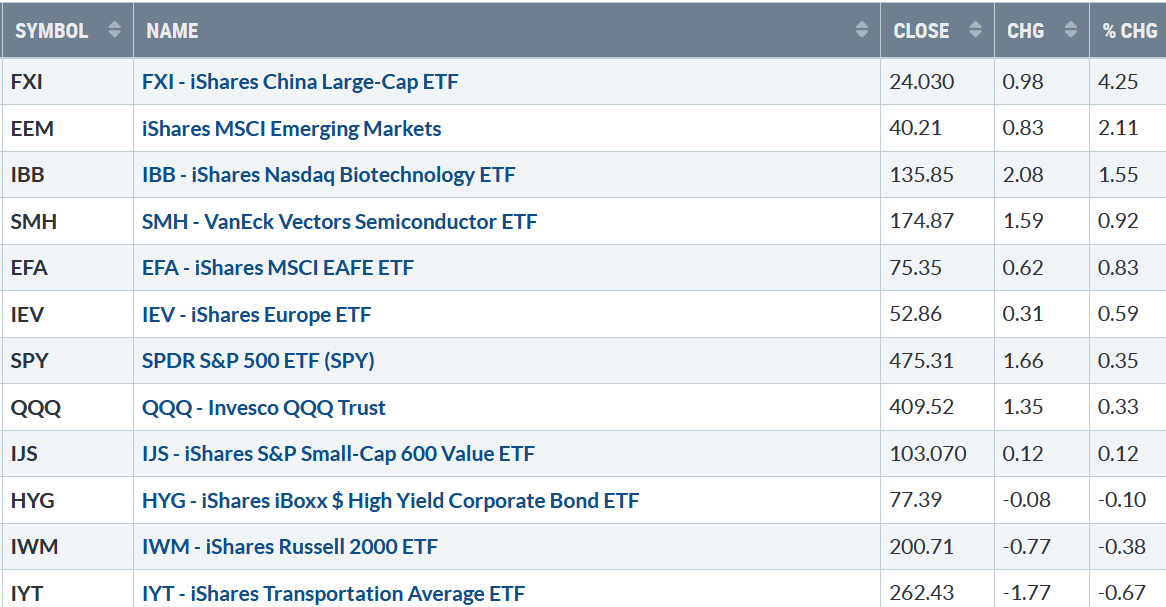
Figure 2: Bonnie’s ETFs Watch List Performance Summary 12/26/23 – 12/29/23
122293 Week ETFs
Source: Stockcharts.com
International markets, including China, were leaders last week. Transports and Small Cap Growth fell.
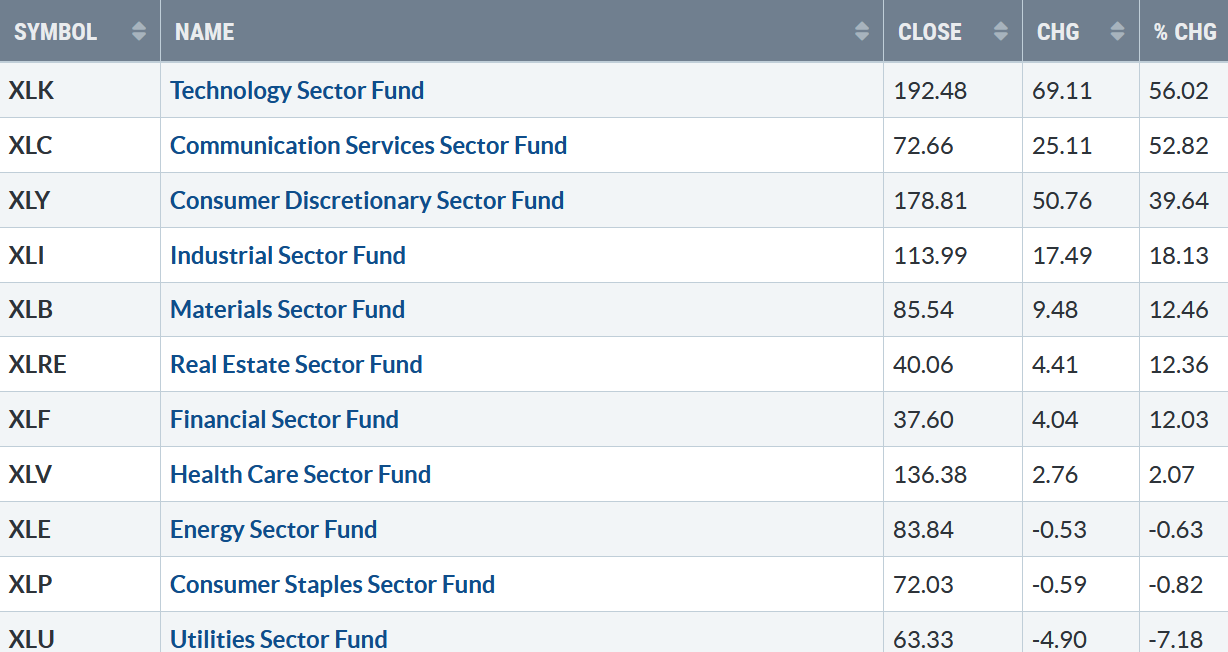
Figure 3: S&P SPDR Sector ETFs YTD Performance Summary 12/30/22 – 12/29/23
122923 YTD SPDR Sectors
Source: Stockcharts.com
2023 was an incredible year after a challenging 2022 historically. Eight of eleven S&P SPDR sectors finished higher for the year. Technology (XLK) and Consumer Services (XLC) were the strongest sectors, while Energy (XLE), Consumer Staples (XLP), and Utilities were the weakest. The SPDR S&P 500 ETF Trust (SPY) gained +26.18%.
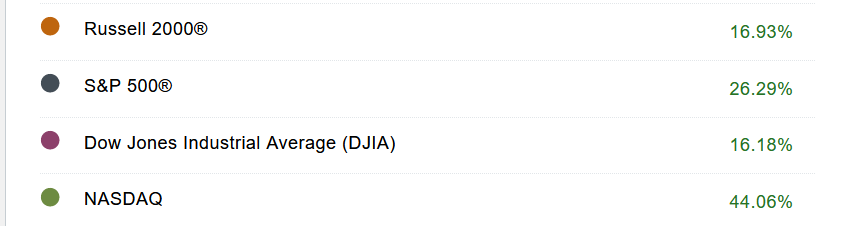
Figure 4: 2023 Market Indices Year-End Performance
 Source: Schwab
The fourth quarter strength led to one of the best years historically.
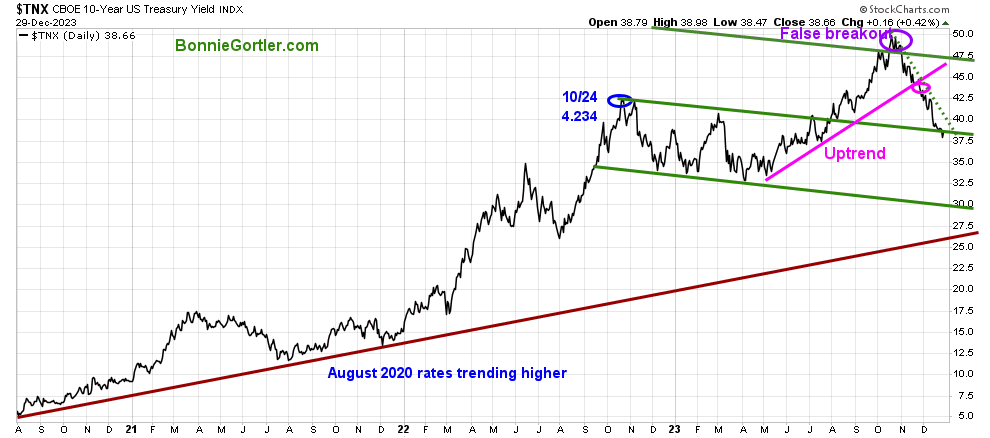
Figure 5: UST 10YR Bond Yields Daily
122923 UST 10 Yr Bond Yields Daily
Source: Stockcharts.com
The 10-year U.S. Treasury yields fell last week, closing below support (middle channel in green) at 3.866%, below the May uptrend (pink line), and in a downtrend (green dotted line) from October after the false break out. Falling yields will continue to be short-term positive for equities. A quick rise in yields could ignite a short, brief pullback.
The major market averages rose for the ninth week, with the Dow up + 0.81%, the S&P 500 up + 0.32% and the Nasdaq gaining +0.12%. The Russell 2000 Index lagged, down -0.34%.
Are you interested in more knowledge about the stock market? Learn how to implement a powerful wealth-building mindset and simple, reliable strategies to help you grow your wealth in my eCourse Wealth Through Investing Made Simple. Learn more here.
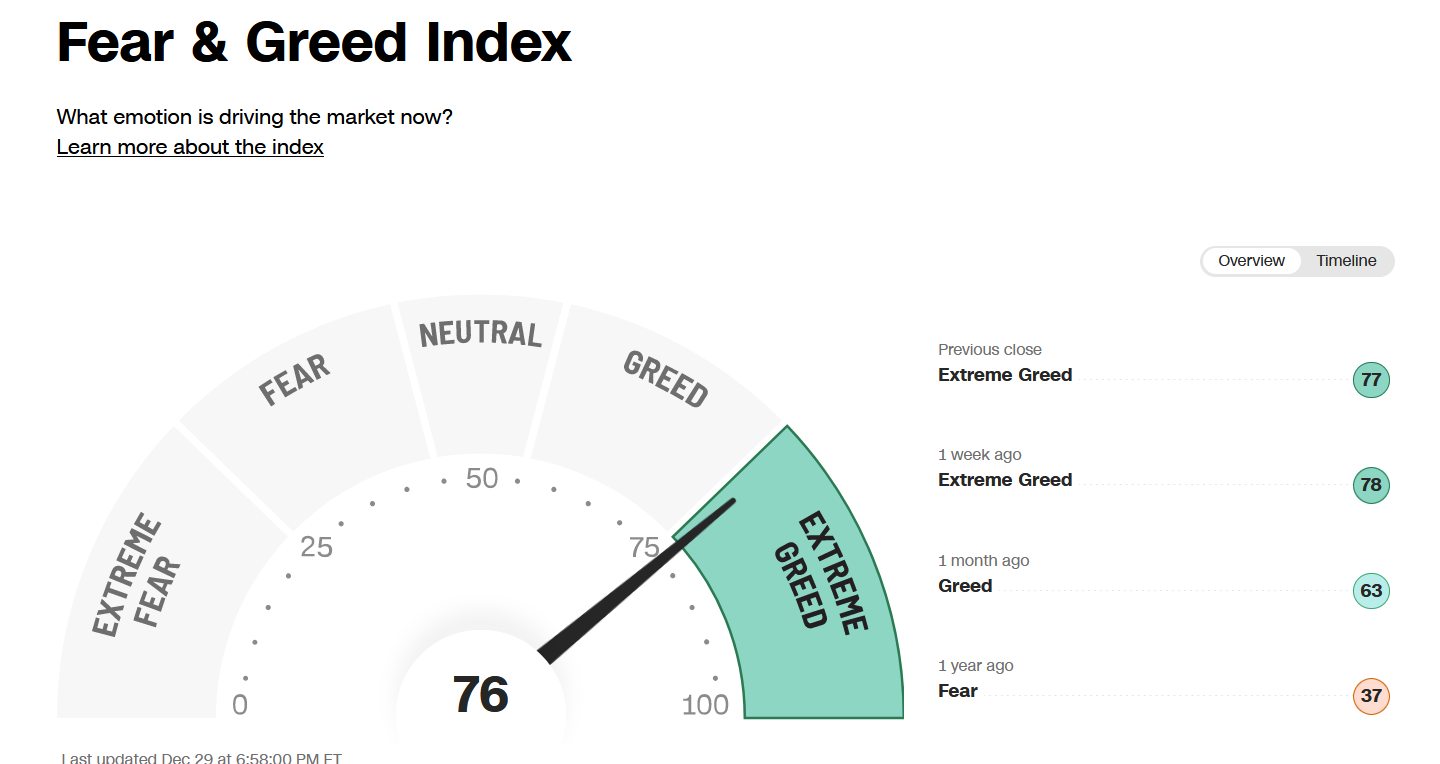
Figure 6: Fear & Greed Index
122923 CNN Fear and Greed Index
Source. CNN.com
Investor sentiment based on the Fear and Greed Index (a contrarian index) measures the market’s mood. The Fear and Greed Index closed at 76, showing extreme greed. A safer buying opportunity lies ahead in 2024.
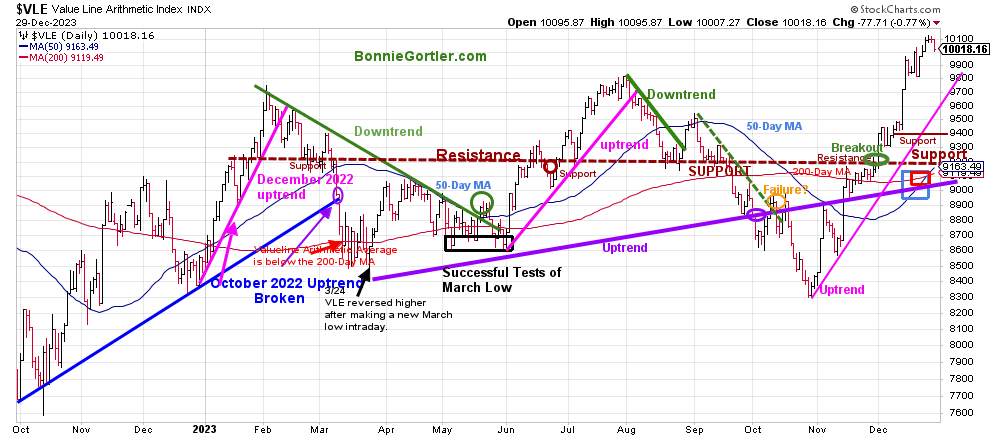
Figure 7: Value Line Arithmetic Average
122923 VLE Daily
Source: Stockcharts.com
The Value Line Arithmetic Index ($VLE) is a mix of approximately 1700 stocks. VLE broke the October 2022 uptrend in early March 2023 (blue line), and April, May, and June successfully tested the March low and ultimately made a new low in October 2023.
The daily trend of VLE remains up. VLE closed at 10018.16, up +0.08% last week, above the 50-day MA, which is rising (blue rectangle), and the 200-day MA (red rectangle), a sign of underlying strength.
Support is 9800, 9400, 9200, and 9000. Resistance is at 10200.
It would remain positive if VLE holds support at 9800 and then turns up, surpassing this week’s high of 10054.39.
Do you want to go deeper into charting? Learn more in the comfort of your home today with my Free 33-minute Training, Charting Strategies to Cut Risk and Trade with the Trend. Sign up here.
Market breadth narrows.
Weekly market breadth was positive on the New York Stock Exchange Index (NYSE) and the Nasdaq. The NYSE had 1476 advances and 1454 declines, with 373 new highs and 16 new lows. There were 2490 advances and 2171 declines on the Nasdaq, with 635 new highs and 193 new lows.
If you want to go more in-depth with charts, I invite you to join my Free Facebook group, Wealth Through Market Charts.
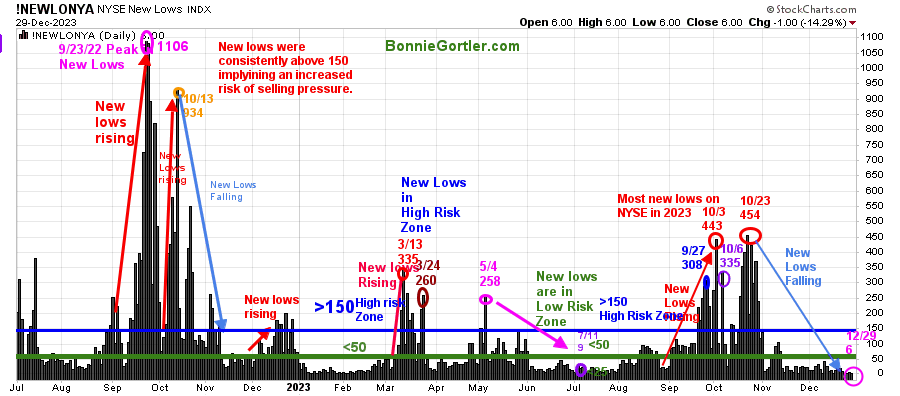
Figure 8: Daily New York Stock Exchange (NYSE) New Lows
122923 NYSE New Lows Daily
Source: Stockcharts.com
Watching New Lows on the New York Stock Exchange is a simple technical tool that helps awareness of the immediate trend’s direction. New lows warned of a potential sharp pullback, high volatility, and “panic selling” for most of 2022, closing above 150. The peak reading was 9/23/22 when New Lows made a new high of 1106 (pink circle), and New Lows expanded to their highest level in 2023 on 3/13/23 (red circle) to 335.
New Lows increased last September (red arrow on the right) toward the high-risk zone greater than 150, peaking at 443 on 10/3, the highest reading since October 2022.
New lows had stopped accelerating in early October. However, the decline was not complete until the end of the month as New Lows made only a slight new high, peaking at 454 (red circle) on 10/23.
Last week, New lows on the NYSE closed at 6 (pink circle), remaining in the lowest risk zone below 25. It would remain positive and imply low risk if New Lows stay between 25 and 50. On the other hand, an increase above 150 would be a warning sign of a market correction. However, New Lows will likely take at least a few weeks to expand to greater than 150 due to the strength of the advance.
Learn more about the significance of New Lows in my book, Journey to Wealth, published on Amazon. If you would like a preview, get a free chapter here.
The rally in Small Caps has stalled?
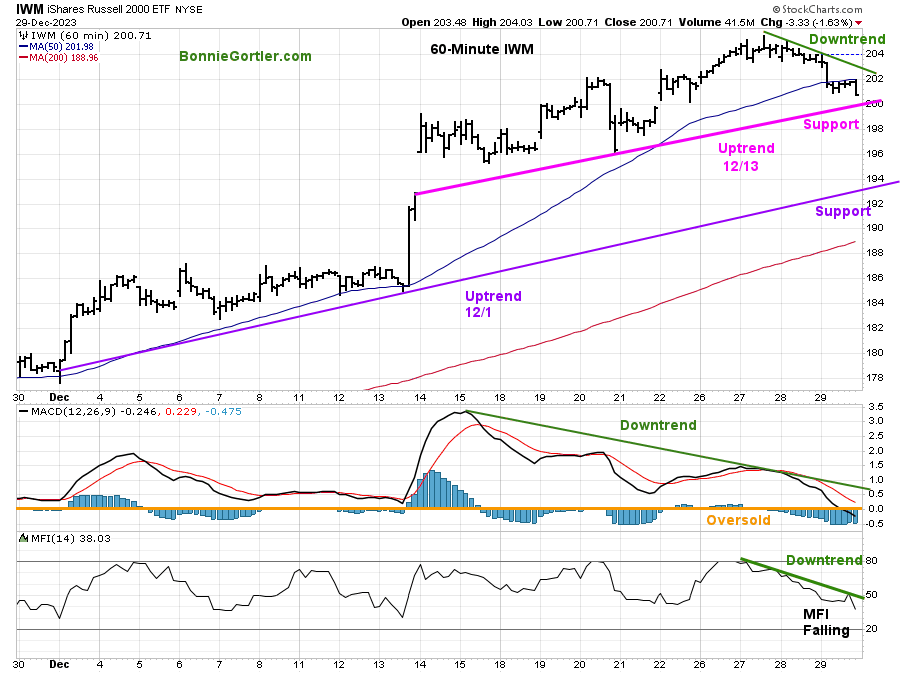
Figure 9: 60 Minute iShares Russell 2000 (IWM) Price (Top) and 12-26-9 MACD (Middle) and Money Flow (Bottom)
122923 IWM 60-Minute
Source: Stockcharts.com
The top chart is the 60-minute iShares Russell 2000 Index ETF (IWM), with a high made on December 28 at 205.49.
There are two significant uptrends, 12/1 and 12/13.
The first support is at 200.00, followed by 196.00 and 193.00. An hourly close below 193.00 gives a downside objective of 181.00.
MACD is on a sell, below 0 (orange line) and falling in a downtrend (green line).
Money flow is falling and is in a downtrend.
Keep an eye on IWM if the uptrend from 12/13 and first support at 200.00 is violated. If so, it would imply the downtrend to continue. However, if the downtrend is broken, and there are two hourly closes above 205.49, it would imply a resumption of the rally.
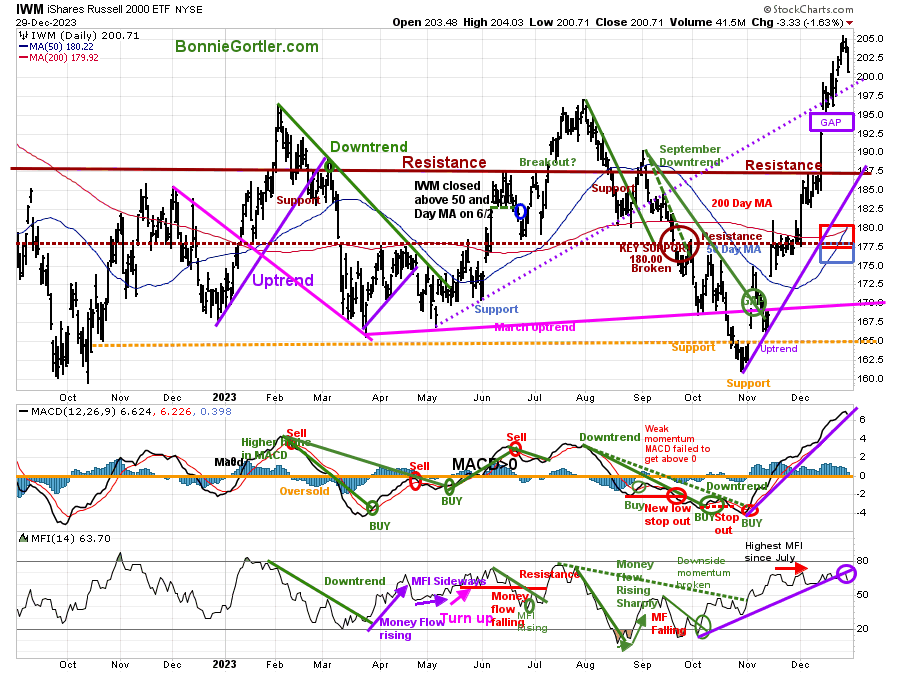
Figure 10: Daily iShares Russell 2000 (IWM) Price (Top) and 12-26-9 MACD (Middle and Money Flow (Bottom)
122923 IWM Daily
Source: Stockcharts.com
The top chart is the daily iShares Russell 2000 Index ETF (IWM), the benchmark for small-cap stocks, with a 50-Day Moving Average (MA) (blue line) and 200-Day Moving Average (MA) (red line) that traders watch and use to define trends. (IWM closed above both).
IWM fell, closing at 200.71, down -0.38% last week above the 50-day MA and the 200-day MA (blue rectangle). Most of the loss came Friday after reversing from its high of 204.03, down -1.63%.
Support is 200.00, 197.50, 193.00, 187.50, 182.50, and 177.50. Resistance is at 205.00 and 210.00. (based on the monthly chart not shown).
MACD (middle chart) remains on a buy, above 0, falling after reaching the year’s highest reading, implying underlying strength and the likelihood another rally will follow any pullback.
Money Flow (lower chart) is falling, breaking the uptrend (purple circle) from October.
A retracement toward first support has started after the recent sharp gains in IWM.
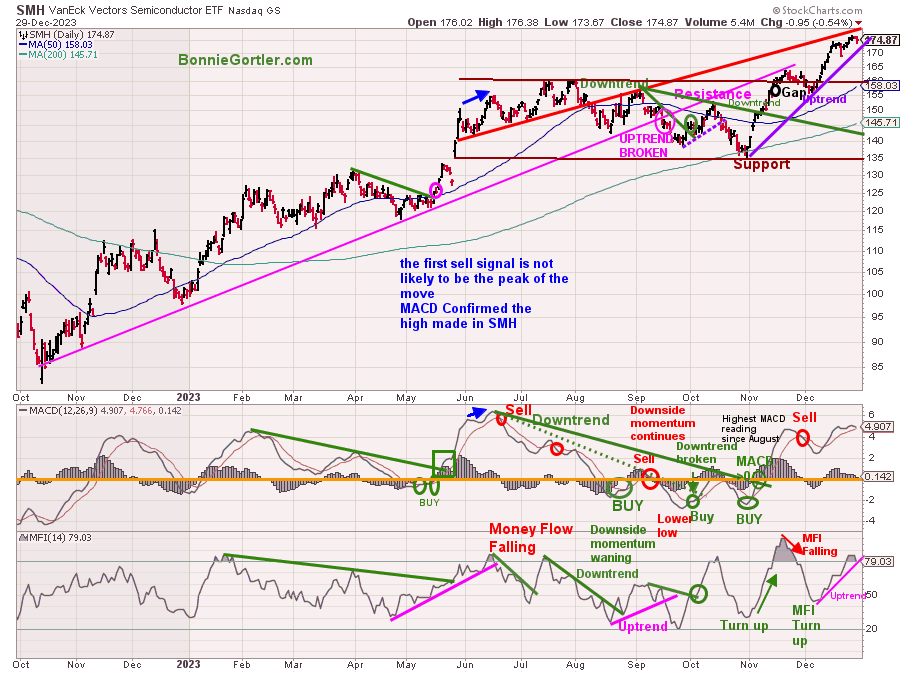
Figure 11: Daily Semiconductors (SMH) (Top) and 12-26-9 MACD (Middle) and Money Flow (Bottom)
122923 SMH Daily
Source: Stockcharts.com
The top chart shows the Daily Semiconductors (SMH) ETF, concentrated mainly in US-based Mega-Cap Semiconductors companies. SMH tends to be a lead indicator for the market when investors are willing to take on increased risk and the opposite when the market is falling.
The Semiconductor ETF (SMH) remains in its October uptrend, gaining +0.92% last week in quiet trading, closing at 174.87. The short-term objective remains 185.00.
Support is at 170.00, 165.00, 158.00, 142.00, and 135.00. Resistance is at last week’s high of 176.75.
MACD (middle chart) is on a sell, rising above 0, a potential triple top (a negative formation) on further weakness in MACD.
Money Flow (lower chart) is falling but remains in an uptrend after not surpassing the November high. A turndown would imply investors moving away from Semiconductor stocks and cutting back on risk.
Look for volatility this week after last week’s tight range if support at 170.00 is penetrated or resistance at 176.75.
For the latest Bonnie’s charts, visit https://www.bonniegortler.com/marketcharts/
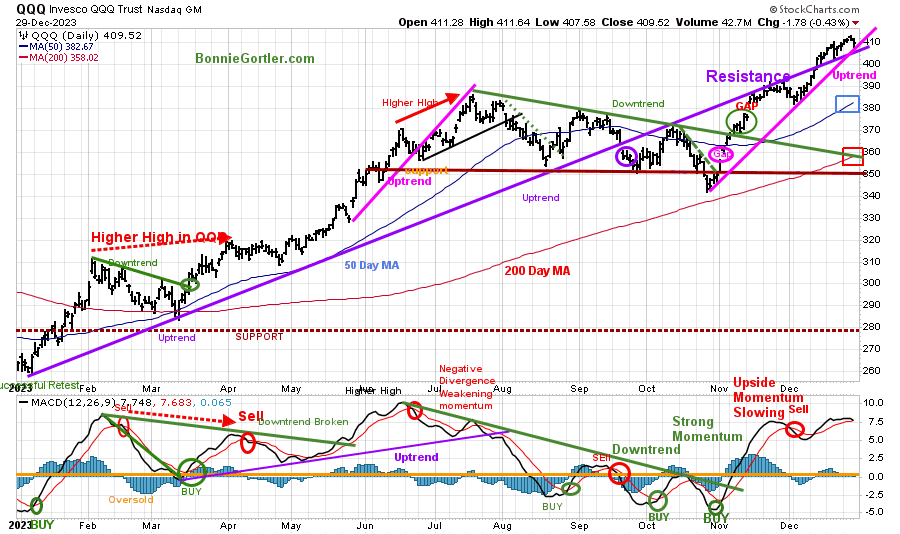
Figure 12: Daily Invesco QQQ Trust (QQQ) Price (Top) and 12-26-9 MACD (Bottom)
122923 QQQ Daily
Source: Stockcharts.com
The chart shows the daily Invesco QQQ, an exchange-traded fund based on the Nasdaq 100 Index. QQQ made a low in October 2022 (red circle), followed by a successful retest of the low in early January 2023 and the start of an uptrend.
Last week, Nasdaq 100 (QQQ) closed at 409.52, up +0.33%. QQQ remains above the 50-day Moving Average (blue rectangle) and the 200-day Moving Average (red rectangle), a sign of underlying strength.
Support is 406.50, 400.00, 390.00, 380.00, 360.00, and 350.00, with resistance at 413.00, slightly above last week’s high. Two closes above would be positive.
The bottom chart, MACD (12, 26, 9), is on a sell, above 0, and falling. A turndown would be a double top and short-term negative.
Be alert to increased volatility next week, as some investors who have waited for the end of 2023 to take profits will likely do so.
Are you interested in more knowledge about the stock market? Learn how to implement a powerful wealth-building mindset and simple, reliable strategies to help you grow your wealth in my eCourse Wealth Through Investing Made Simple. Learn more here.
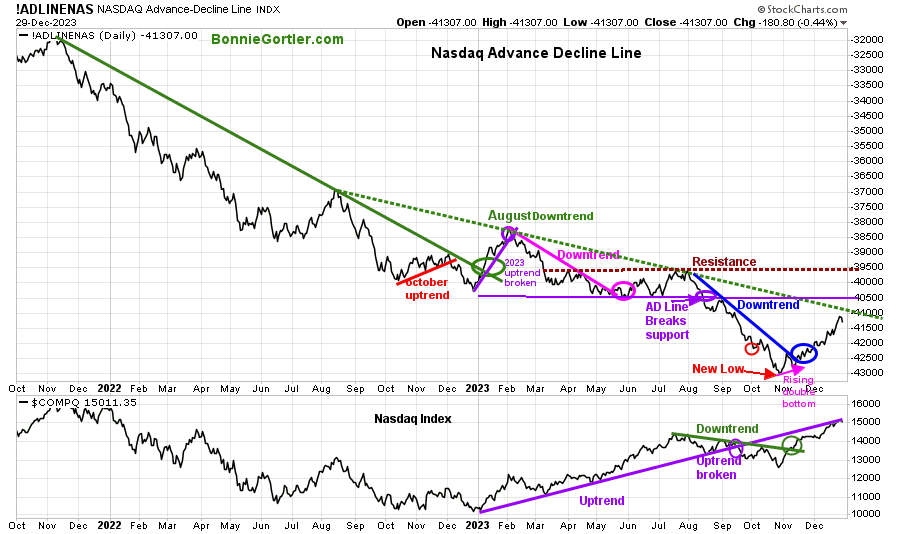
Figure 13: Nasdaq Advance Decline Line Daily (Top) and Nasdaq (Bottom)
122923 Daily Nasdaq Cumulative Advance-Decline Line
Source: Stockcharts.com
The top chart is the Nasdaq Daily Advance-Decline Line, a technical indicator that plots the difference between the number of advancing and declining stocks. In January 2023, the October 2022 downtrend was broken (solid green line) but quickly reversed lower in February 2023, when most of the stock participation was predominantly the large Mega Cap stocks.
The AD-Line (top chart) broke support (purple circle) in August 2023 and continued making new lows in October (red arrow). Then, a favorable rising double formation formed, combined with a break of the August downtrend (blue circle). Market breadth improved in November and December as the rally broadened. Time will tell if the AD-Line downtrend will break from August 2022 (green dotted line).
Nasdaq (lower chart) broke the July downtrend (green line) and continued to rise. However, notice that the index remains below the uptrend (purple line), which broke down in September and now acts as resistance.
If market breadth continues improving and the Nasdaq rises, the rally will continue. If not, a pullback is likely sooner than later.
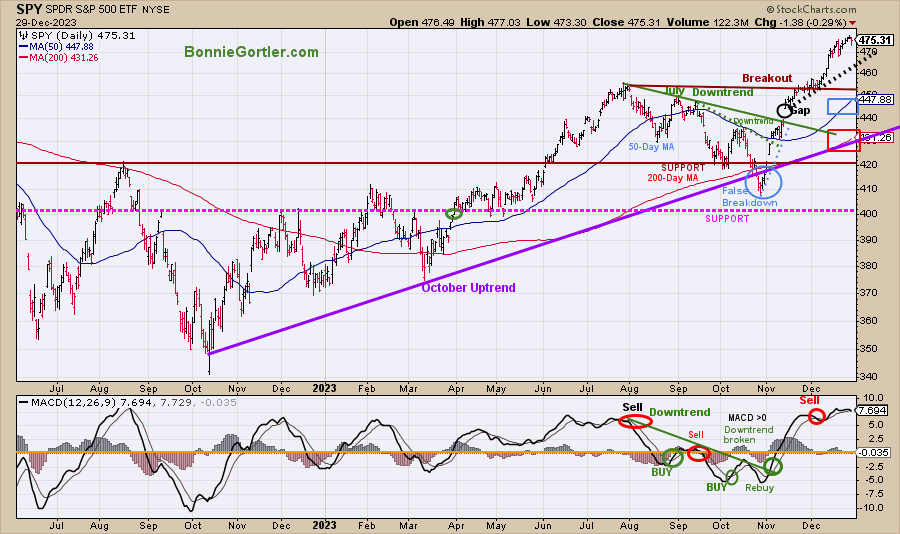
Figure 14: The S&P 500 Index (SPY) Daily (Top) and 12-26-9 MACD (Bottom)
122923 SPY Daily
Source: Stockcharts.com
The S&P 500 (SPY) had a false breakdown (blue circle) in October after being in an uptrend (purple line). Two downtrends were in effect and broken to the upside in September (green dotted line) and August (green solid line).
The daily trend remains up.
The SPY closed at 475.31, up +0.35% for the week, remaining above the 50-day Moving Average (blue rectangle) and the 200-day Moving Average (red rectangle), a sign of strength.
Support is at 468.00, 460.00, 455.00, 447.00, 430.00, and 420.00. A higher objective of 485.00 remains for the SPY.
MACD (bottom chart) remains on a sell but is close to a repeat sell if SPY weakens.
It would be positive if SPY remains above last week’s low of 473.30. However, with short-term momentum extended, a consolidation may occur if SPY closes below 468.00 before the rally resumes.
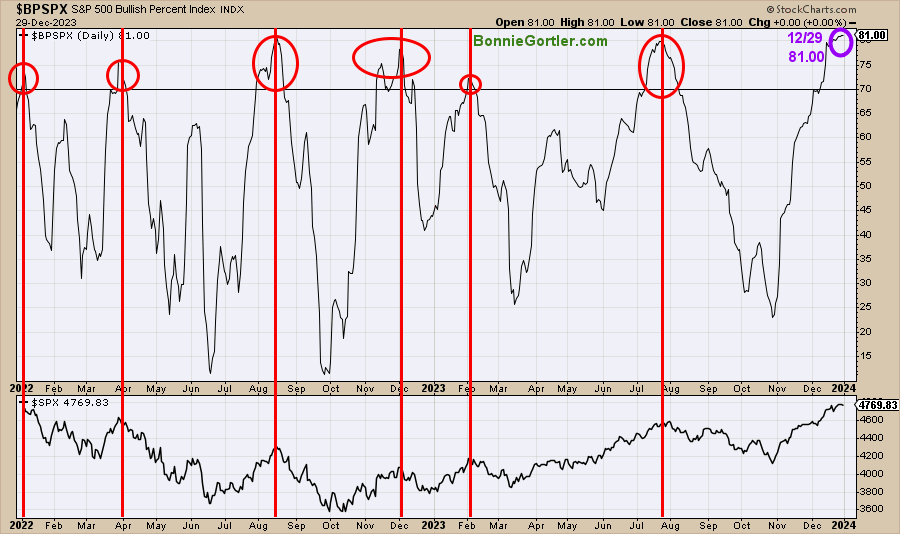
Figure 15: S&P 500 Bullish Percent Index
122923 SPY Bullish Percentage Index Daily
Source: Stockcharts.com
The Bullish Percent Index (BPI), developed by Abe Cohen in the 1950s, is a breadth indicator based on the number of stocks based on Point and Figure Buy signals. The indicator helps you know the market’s health and when it’s overbought or oversold.
When the bullish percent index is above 70%, the market is overbought, and when the indicator is below 30%, the market is oversold. Like other overbought indicators, sometimes it does not get as high or as low.
In 2022 and 2023, the indicator reached 70 (overbought) six times (red circles). All occurrences were near market peaks (red lines). Last week, the BPI rose slightly, closing on 12/29/23 at 81.00 (purple circle). A reading over 70, followed by a retracement below 70, would give a sell signal on this indicator.
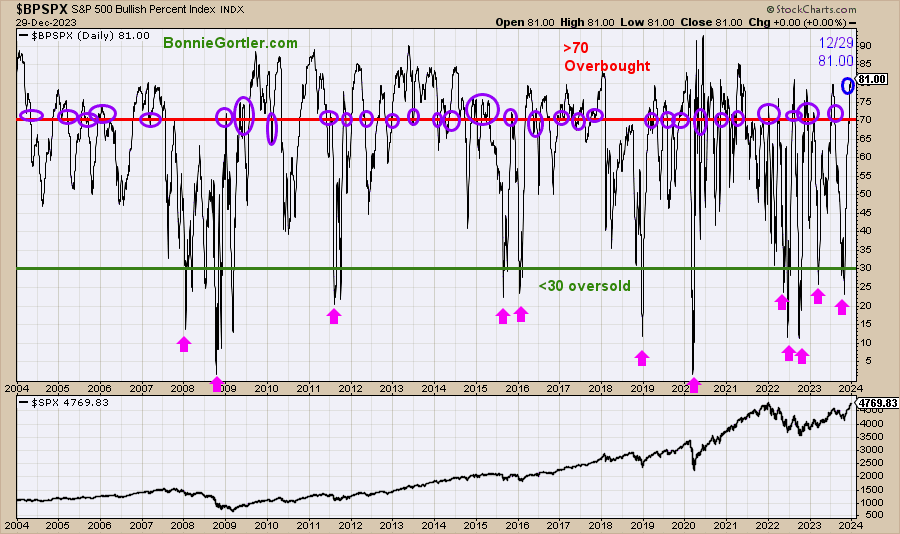
Figure 16: S&P 500 Bullish Percent Index 2004-2023
122923 Long-Term Perspective SPY Bullish Percentage Index Daily
Source: Stockcharts.com
A longer-term perspective of The Bullish Percent Index (BPI) shows how the indicator can remain overbought and oversold for long periods. On the other hand, BPI sometimes fails to reach overbought or oversold conditions. BPI is overbought at 81.00 (blue circle). No technical indicators are perfect. Past performance does not guarantee any future results. Remember, they are guides to help you increase the probability of keeping you on the right side of the market and managing your risk.
Summing Up:
Goodbye to 2023, and welcome to 2024. The tape remains positive with higher objectives. After a nine-week win streak, expect an increase in volatility this week with profit-taking from those who waited for 2024. Short-term momentum indicators are extended and have started to turn down, implying risk has increased of a brief pullback before a resumption of the rally.
Remember to manage your risk, and your wealth will grow.
Let’s talk investing. You are invited to set up your Free 30-minute Wealth and Well-Being Strategy session by clicking here or emailing me at Bonnie@BonnieGortler.com. I would love to schedule a call and connect with you.
Disclaimer: Although the information is made with a sincere effort for accuracy, it is not guaranteed that the information provided is a statement of fact. Nor can we guarantee the results of following any of the recommendations made herein. Readers are encouraged to meet with their own advisors to consider the suitability of investments for their own particular situations and for determination of their own risk levels. Past performance does not guarantee any future results.


Create more wealth in your life
with these simple strategies.
As an added bonus you will also
receive BG’s Updates and Ezine

Discover how to quickly create more well-being in your life with these simple strategies.
As an added bonus you will also
receive BG’s Updates and Ezine

As an added bonus you will receive BG’s Updates and Ezine

All work listed on BonnieGortler.com is licensed under a Creative Commons Attribution - Noncommercial - No Derivative Works 3.0 Unported License.


Free Report:
Grow and Sustain Your Wealth
Discover how to grow your money with these easy, simple steps.

