

10 Simple Tips for Financial Well-Being
07/01/2026
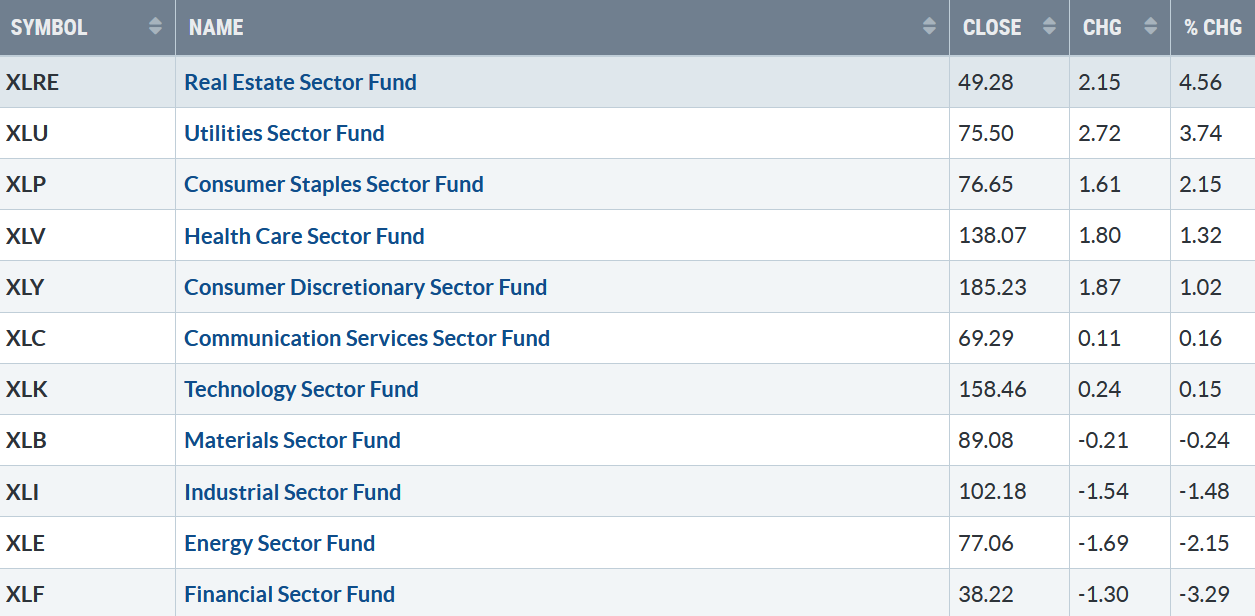
The U.S. major averages started 2022 with their largest quarterly decline in two years. Seven of the eleven sectors rose last week; all were stronger than the SPDR S&P 500 ETF Trust (SPY), up +0.05%. Defensive sectors, Real Estate (XLRE) and Utilities (XLU) were the best performing sectors, while Energy (XLE) and Financial (XLF) were the weakest.
3/25/22 – 4/01/22
S&P SPDR Sector ETFs Performance Summary
40122 SPDR Sectors
Source: Stockcharts.com
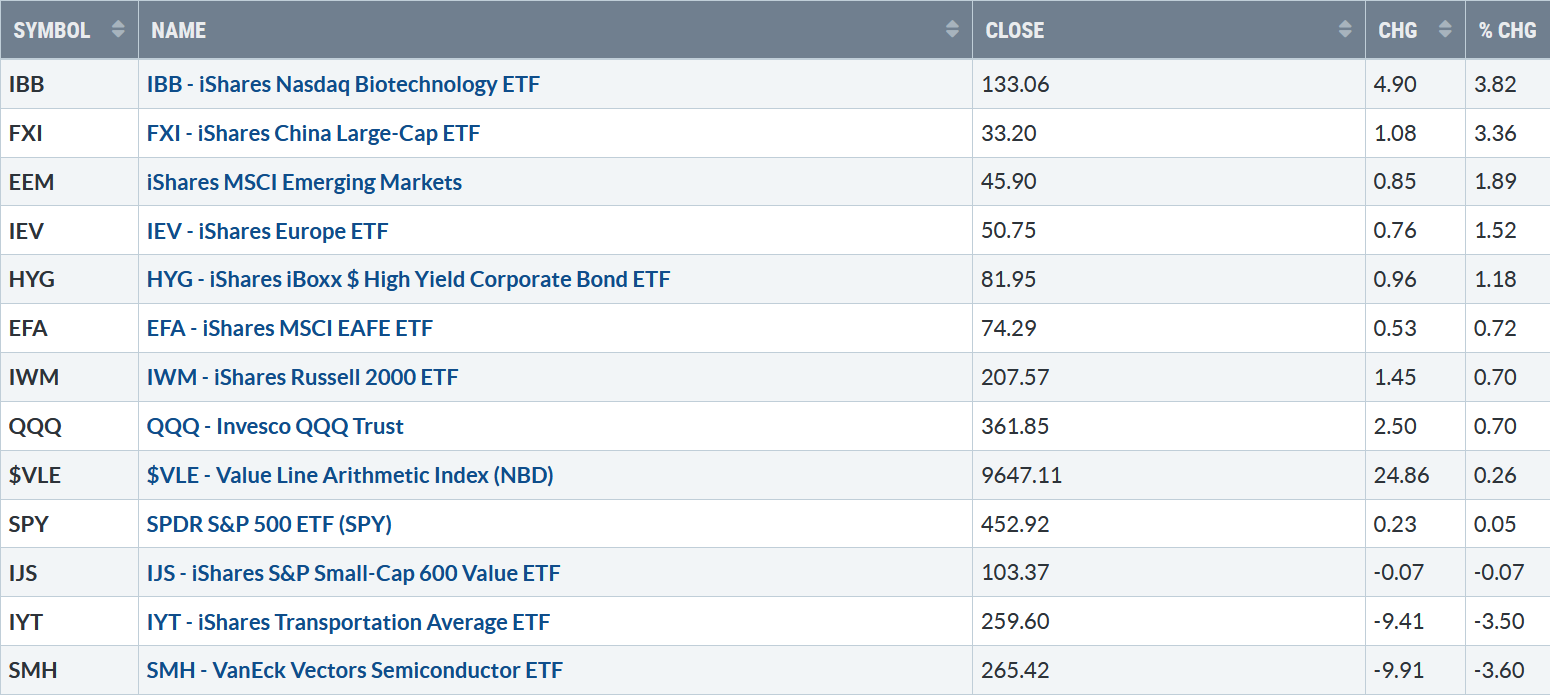
Figure 2: Bonnie’s Mix of ETFs To Monitor
Performance Summary 3/25/22 – 4/01/22
040122 Week ETFs
Source: Stockcharts.com
Biotechnology and Hi Yield, which have been laggards, showed signs of life. Global markets were strong with no follow-through to the previous week’s decline. Transportation and Semiconductors were under selling pressure. Transportation (IYT) was especially weak on Friday, down -3.83% as trucking companies fell sharply. It will be unfavorable if both sectors continue to fall weaker than the broad market. Watch the tape action in these sectors closely.
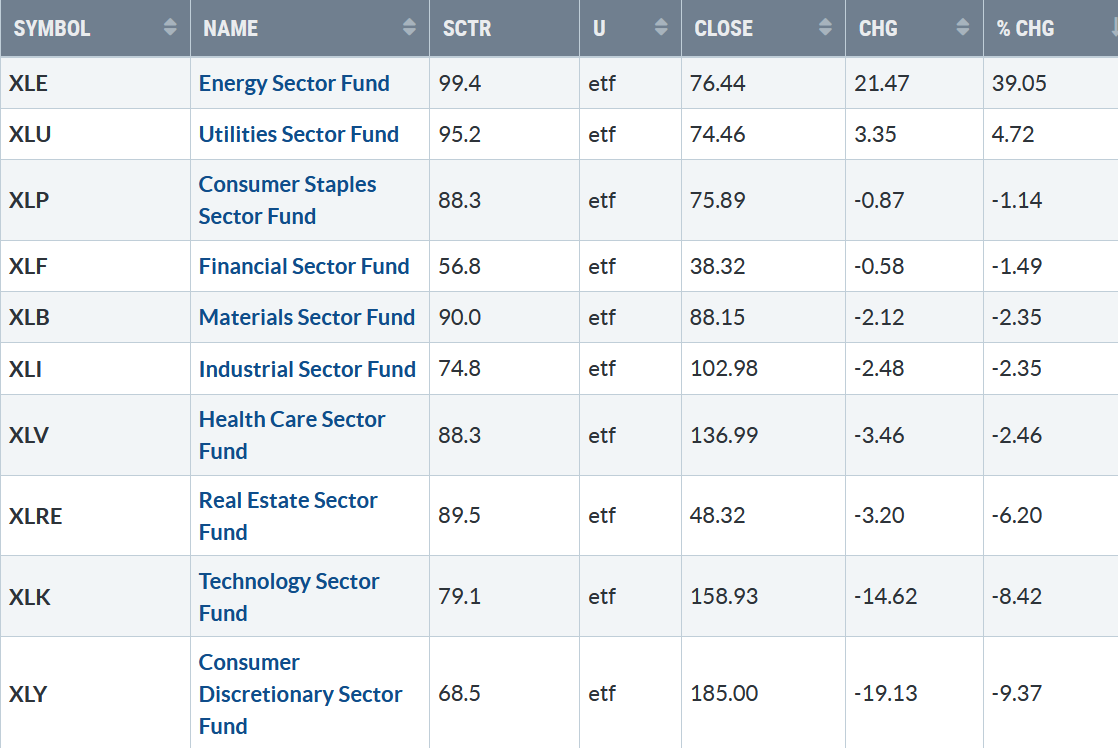
Figure 3: S&P SPDR Sector ETFs Performance Summary
1st Quarter 12/31/21 – 3/31/22
033122 Sectors Quarter
Source: Stockcharts.com
Energy for the first quarter of 2022 was the star, while, Technology and Consumer Discretionary stocks were hit hard.
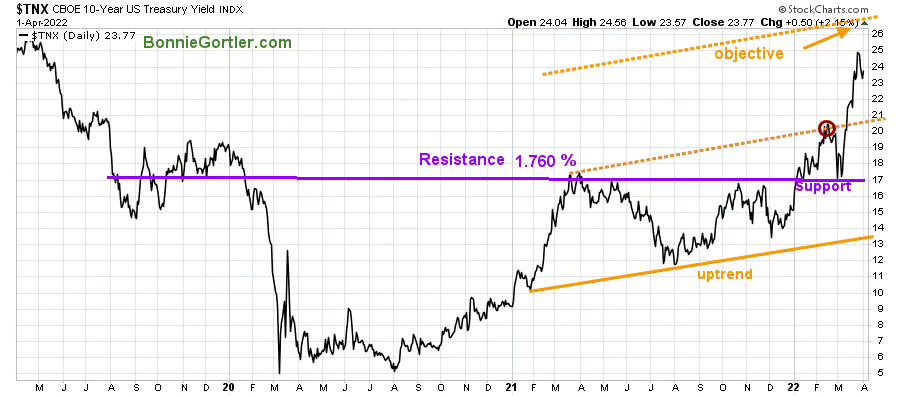
Figure 4: UST 10YR Bond Yields Daily
40122 UST 10YR Bond Yields Daily
Source: Stockcharts.com
The 10-Year U.S. Treasury yields fell from 2.492 % a week earlier, closing at 2.377%. The upside objective remains at 2.7%, while the 5 Year U.S Treasury yields increased, closing at 2.56%.
For the week, the Dow fell -0.12%, S&P 500 up +0.06%, Nasdaq gained +0.65%, the Russell 2000 Index up +0.63 %, and the Value Line Arithmetic Index (a mix of approximately 1700 stocks gained +0.26%.
Weekly market breadth improved on the New York Stock Exchange Index (NYSE), with 2208 advances and 1385 declines. However, 262 new highs and 281 new lows were not impressive. Nasdaq had 2884 advances and 2416 declines with 269 new highs and 404 new lows.
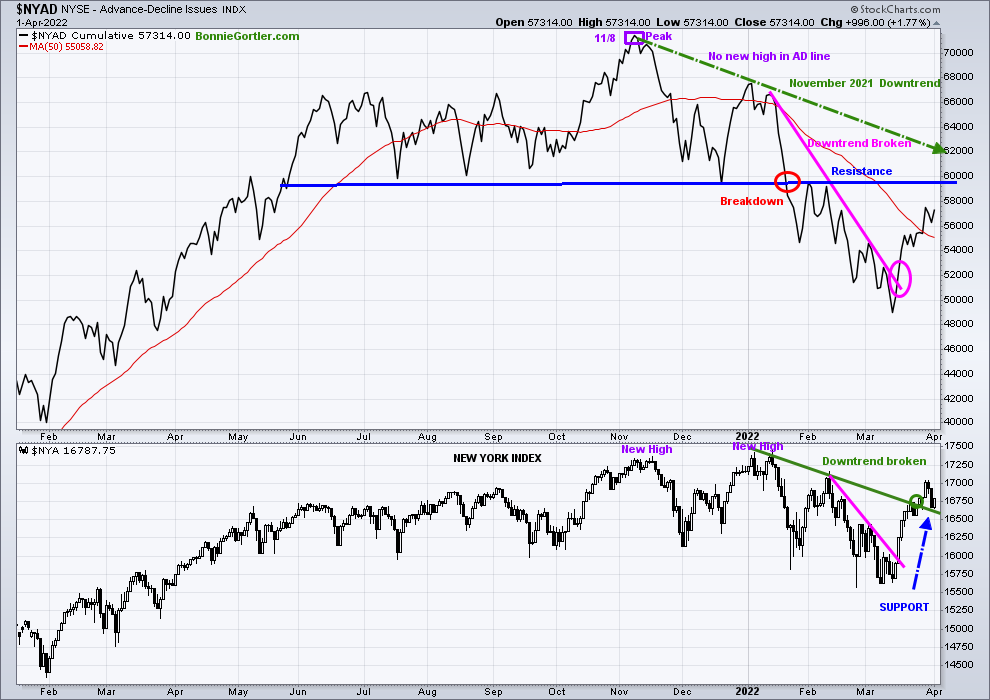
Figure 5: NYSE Cumulative Advance-Decline Line (Top) and NYSE Index (Bottom)
40122 NYSE Price CUM AD LINE
Source: Stockcharts.com
The NYSE A/D Line (top chart) made a new high on 11/8/21 (purple rectangle). However, in 2022 only the New York Index made a new high, unconfirmed by the NYSE AD line, which had a lower high.
In March, the AD Line and New York Index broke their downtrends. (pink line top and bottom chart).
The AD Line November downtrend remains (green dotted line). Strength in market breadth where the NYSE AD Line closes above resistance (blue line top chart) is needed for the rally to continue in the second quarter of 2022 and be sustainable. Keep a close eye.
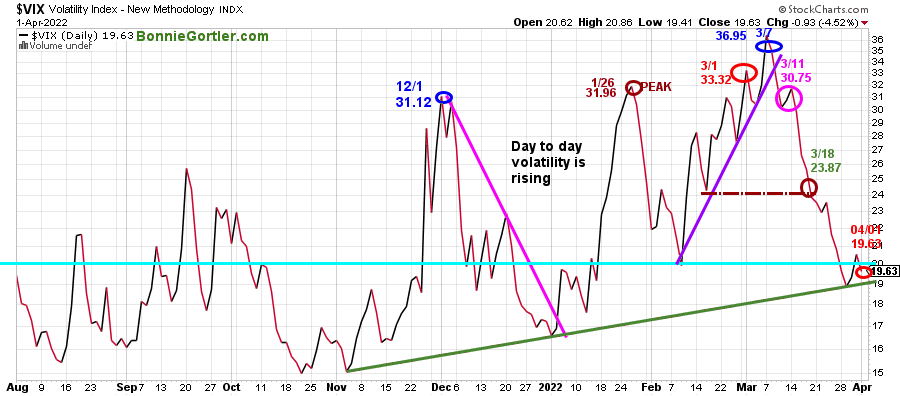
Figure 6: CBOE Volatility Index VIX
40122 DAILY VIX
Source: Stockcharts.com
The CBOE Volatility Index ($VIX), a measure of fear, has been trading above 20.00 for most of 2022,
Previously VIX made a high at 31.96 on 1/26 (brown circle), on 3/1 at 33.32 (red circle), and 36.95 on 3/7 (blue circle).
Last week, VIX closed on 4/01 (orange circle) at 19.63.
It will be favorable if VIX remains below 20. On the other hand, if VIX starts to climb above 24.00, the market will likely go lower, and day-to-day volatility will increase.
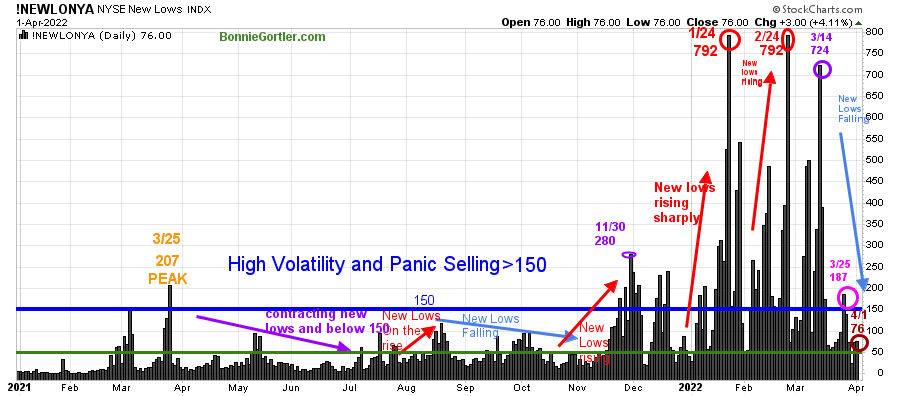
Figure 7: Daily New York Stock Exchange (NYSE) New Lows
40122 Daily NYSE NEW LOWS
Source: Stockcharts.com
Watching New lows on the New York Stock Exchange is a simple technical tool that helps awareness of the immediate trend’s direction.
New lows warned of a potential sharp pullback, high volatility, and “panic selling” for most of 2022, closing above 150. Learn more about the significance of New Lows in my book, Journey to Wealth, published on Amazon. Here is an excerpt, when new lows are above 150, the market is negative, higher risk, and selling is taking place. Sometimes it could be severe, and sometimes on a very nasty day, you can have “panic selling,” and big wild swings (high volatility) to the downside may occur.
As the market sold off in January, New Lows rose sharply, peaking at 792 on 1/24 (red circle), and then contracted but not enough to be in a low-risk zone before rising again on 2/24 at 792, matching the 1/24 peak. On 3/14, it was a positive sign new lows stayed below January and February’s readings, and the latest rally began.
New Lows closed at 187 (pink circle) above 150 on 3/18 (brown circle); however, New Lows contracted to close at 76 on 4/01. It would be encouraging if News Lows fall between 25 and 50, indicating lower risk and a sign that the rally will continue.
Be alert if New Lows expand to above 150 and continue to increase, then I would expect a short-term pullback.
Figure 8: Daily Nasdaq Advance-Decline Line
Source: Stockcharts.com
The daily Nasdaq advance-decline line peaked in February 2021 (brown circle), followed by failed attempts to make a new high. After breaking the October uptrend (blue dotted line), the Nasdaq AD-Line made a series of lower highs and lower lows in November, December, and January and trended down.
The July 2021 downtrend (purple line) remains. After making a lower low earlier in the month, a V bottom identical to December 2019 (purple rectangle) has formed. The downtrend from November (blue) penetrated is a positive sign that the worst of the decline is over.
In addition, after continuous new lows, the Weekly Nasdaq Advance-Decline Line broke above the November downtrend (chart now shown), however, no follow-through as breadth flattened last week.
Small Caps have the potential to break out to the upside.
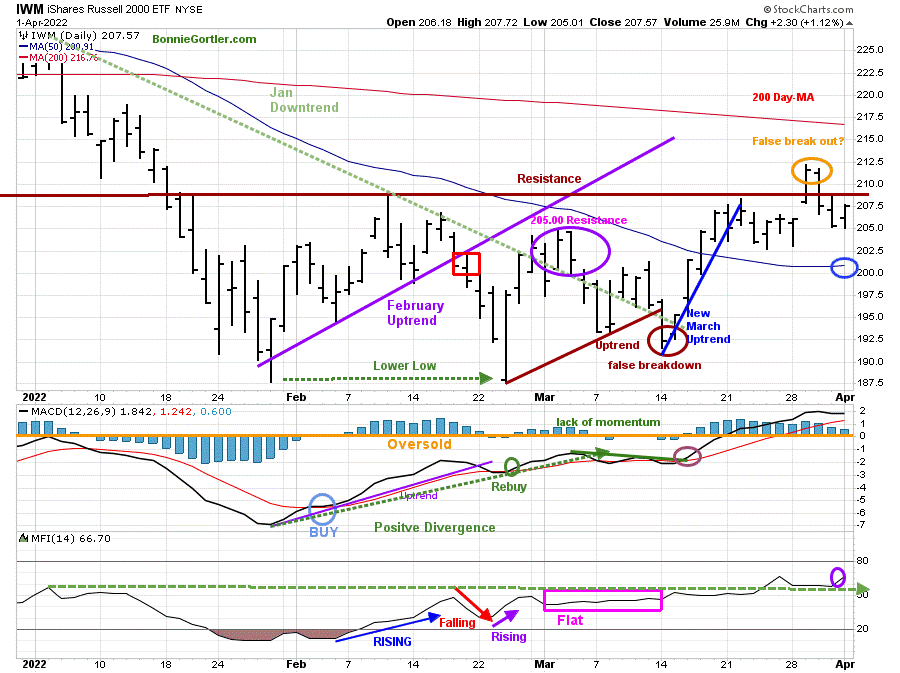
Figure 9: Daily iShares Russell 2000 (IWM) Price (Top) and 12-26-9 MACD (Middle) and Money Flow (Bottom)
40122 Daily IWM
Source: Stockcharts.com
The top portion of the chart is the daily iShares Russell 2000 Index ETF (IWM), the benchmark for small-cap stocks, with a 50-Day Moving Average (MA) (blue line) and 200-Day Moving Average (MA) that traders watch and use to define trends. A false breakout occurred in November 2021 in IWM after being in a nine-month trading range.
The February uptrend and support at 200.00 was penetrated on 2/18 (red rectangle), but IWM remained below its 50 and 200-Day Moving Average. In early March, IWM failed to close over Resistance at 205.00 and turned lower, a false breakout of the 2022 downtrend (green dotted line).
IWM gained + 0.70 % for the week closing at 207.57, slightly above the first Resistance of 207.50. IWM stalled above 210.00 and turned down potentially a false break out. On the other hand, it remains encouraging IWM closed above the 50-Day MA (light blue circle) and closed at its high on Friday, stronger than the S&P 500 for the week.
Short-term resistance is 210.00, 212.50, and 217.00. Support is at 205.00 and 200.00.
MACD (middle chart) has not shown much upside momentum in 2022, failing to get above 0. However, on the latest rally, MACD’s is above 0, signaling underlying strength. Be alert to a sell if IWM declines.
Since February, Money Flow (lower chart) has whipsawed in a trading range with only slight upticks (green dotted line), but this pattern has changed. Money Flow is rising and remains at its highest level, making a new high for the year (purple circle).
IWM is poised for a potential breakout to the upside with a close above 212.50.
New Development: The intermediate-term MACD generated a BUY
Figure 10: Weekly iShares Russell 2000 (IWM) Price (Top) and 12-26-9 MACD (Bottom)
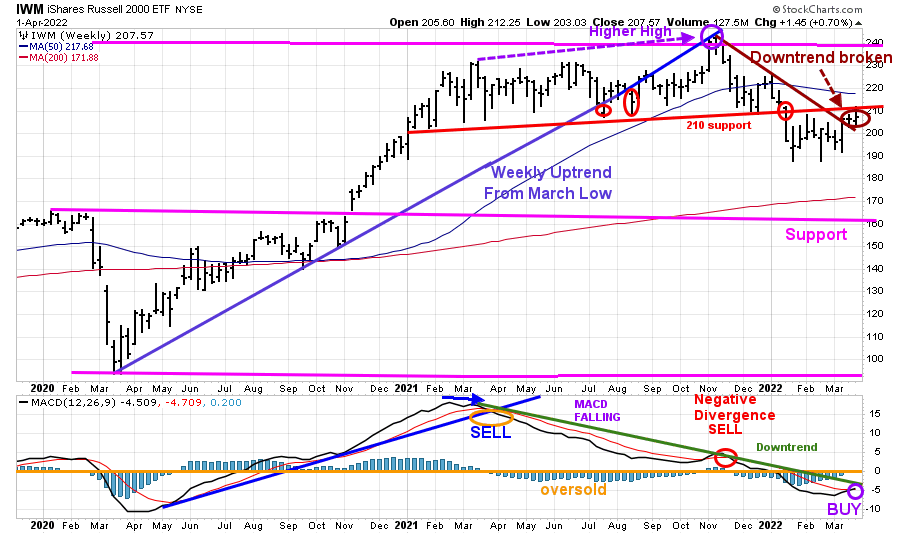
40122 Weekly IWM
Source: Stockcharts.com
The Russell 2000 (IWM) (top chart) closed below the March uptrend (blue line) in July 2021 (red circle), but no significant decline. A consolidation began, followed by a new high in November 2021 (purple circle),
Even though IWM didn’t close above previous old support at 210.00 last week, IWM closed above the downtrend for two weeks (brown circle), shifting the trend to up.
It’s positive the downtrend has been broken combined with a new buy signal on MACD (lower chart). I would like to see the March 2021 downtrend broken (green line) to confirm the buy setting up the potential next leg higher.
MACD and MONEY FLOW show that QQQ is likely to continue higher.
Figure 11: Daily Invesco QQQ Trust (QQQ) Price (Top) and 12-26-9 MACD (Bottom)
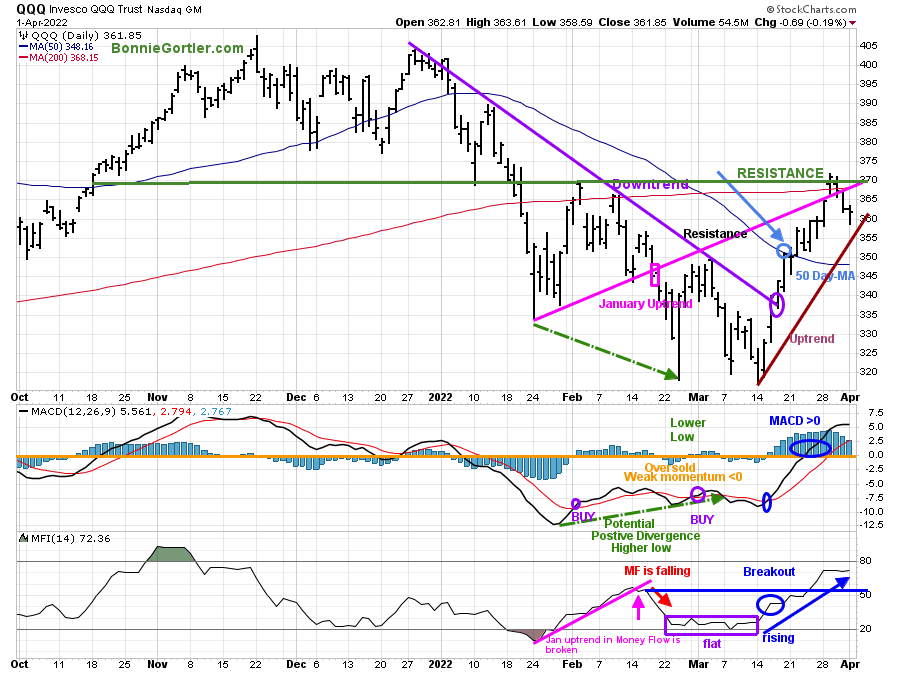
40122 Daily QQQ
Source: Stockcharts.com
The chart shows the daily Invesco QQQ, an exchange-traded fund based on the Nasdaq 100 Index with its 50 and 200-Day Moving Average. QQQ accelerated lower after breaking the January uptrend (pink rectangle), penetrating the January lows, then stalled at 351.00 resistance in early March and turned lower.
Last week QQQ was up +0.26%, closing at 361.85, above its 50- Day MA, but stalling at the Resistance of 370.00, which coincided with the 200-Day Moving Average.
Resistance remains at 370.00, 375.00, followed by 390.00. Support is 355.00, 345.00, and 340.00. A close below 355.00 would break the short-term uptrend (brown line).
The middle chart is MACD (12, 26, 9), a measure of momentum. MACD remains on a buy, above 0, showing underly strength in momentum.
Money Flow is rising after breaking out of its sideways trading range to its highest level since November 2021.
A close above 370.00 will be a clue there is more short-term upside on its way to 390.00.
Figure 12: Van Eck Semiconductors (SMH) Daily Price (Top), 12-26-9 MACD (Middle), and Money Flow (Bottom)
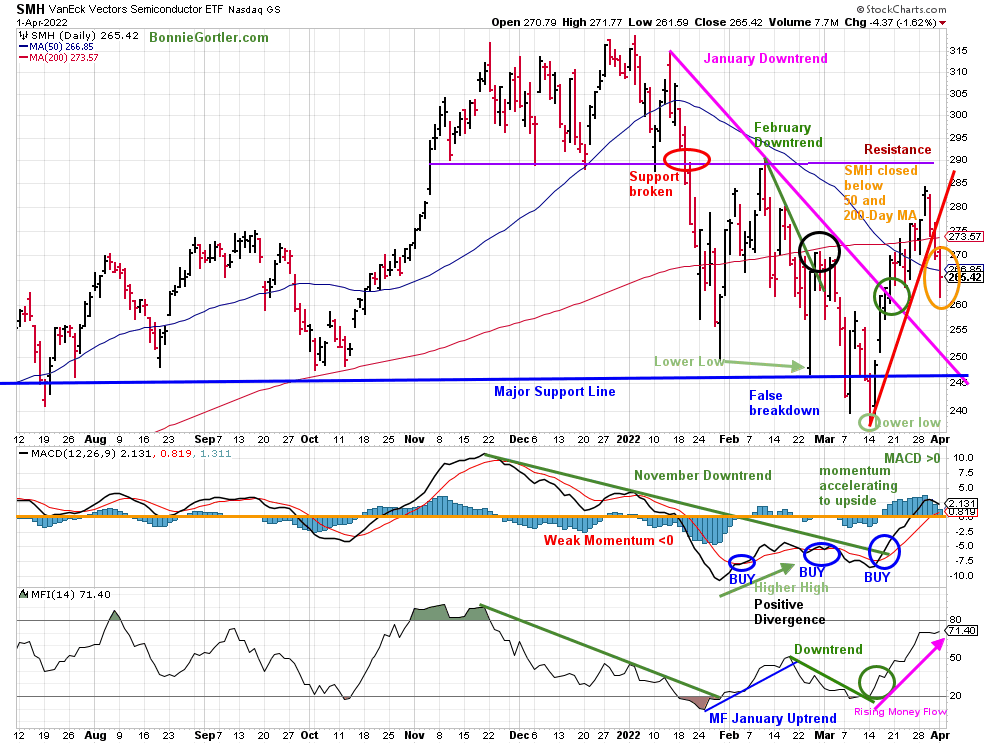
40122 Daily SMH
Stockcharts.com
SMH in 2022 has been volatile. In late January, support was broken (red circle) and then fell sharply but held the October 2021 lows. SMH then rallied but turned down again, closing below support at 240.00 on 3/14/22, a false breakdown.
SMH rose in March but could not get above Resistance and turned down last week, closing at 265.42, down -3.60%, closing below the 50 and 200-Day Moving Average, breaking the March uptrend (redline).
Support is at 255.00, followed by 250.00 and 240.00. Resistance is at 270.00, 280.00, and 290.00.
MACD (middle chart) remains on a buy (green circle) but has turned down above 0.
Money Flow (lower chart) is rising and trending higher.
Warning: Weakness in Semiconductors compared to QQQ breaks below support.
Figure 13: Daily Relative Strength Ratio Semiconductors (SMH)/ Invesco QQQ Trust (QQQ)
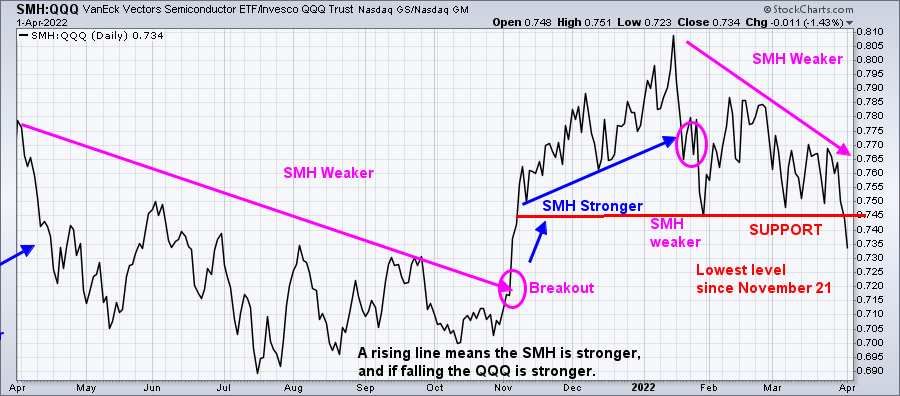
40122 Daily SMH-QQQ Relative Strength Ratio
Stockcharts.com
A rising line means the SMH is stronger, and if falling, the QQQ is stronger.
QQQ is leading in relative strength compared to the SMH.
SMH has remained weaker than QQQ since early 2022. It’s not a good sign that the SMH /QQQ ratio broke below support last week and is at the lowest level since November 2021. Continued underperformance in SMH compared to QQQ is negative.
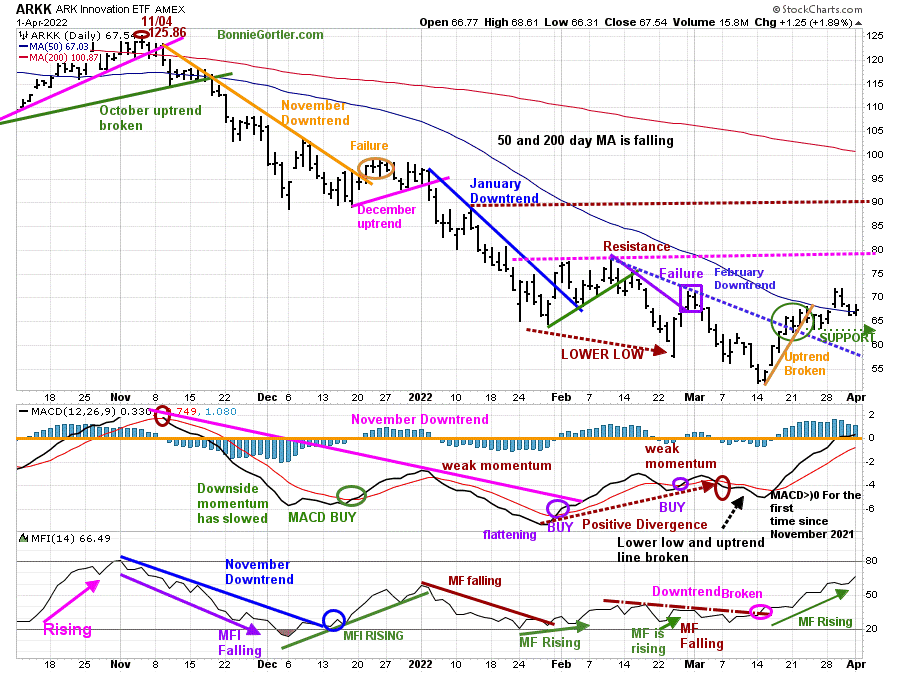
Figure 14: Daily ARK Innovation (ARKK)
40122 Daily ARKK
Source: Stockcharts.com
ARK Innovation (ARKK) is an actively managed ETF by Cathie Wood that seeks long-term growth and is highly volatile. ARKK broke its September short-term downtrend (brown line) in October 2021. Downside momentum temporarily subsided when ARKK broke its February downtrend (purple line), failing to close above Resistance (pink dotted line). Rally attempts failed as ARKK made lower lows into March.
ARKK rose +4.70% last week, outperforming the major averages, closing at 67.74, remaining above the February downtrend (blue dotted line).
Resistance remains at 70.00, 72.50, and 80.00. Support remains at 63.00, 60.00, and 57.00.
MACD had failed to get above 0 since November 2021. Repeat buys have been early. However, MACD is now above 0 and can give a sell.
Money flow (lower chart) broke February’s downtrend (brown dotted line), confirming MACD, and remains positive and is at its highest level in 2022.
Remember, ARKK remains high-risk and volatile. Be alert to 10% swings or more in both directions that can occur.
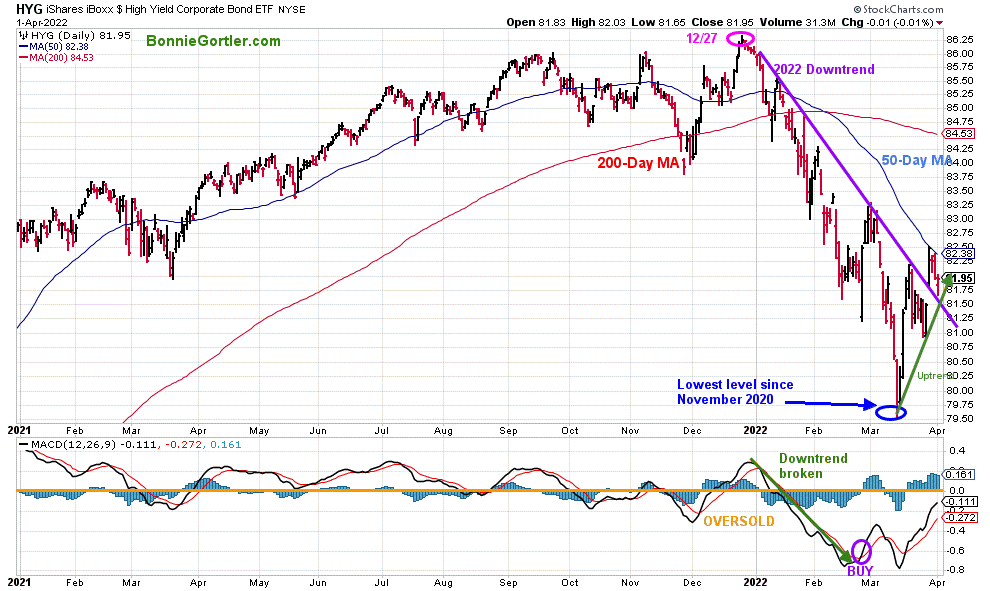
Figure 12: I Shares Hi Yield Corporate Bond (HYG)
40122 Daily HYG
Source: Stockcharts.com
Hi-Yield Bonds (HYG) peaked on 12/27/21 and appeared to stabilize in late February but reversed lower, reaching their lowest level since November 2020 (blue circle).
HYG rose +1.18%, and its positive HYG broke the downtrend, but more upside is needed to close above its 50-Day MA at 82.38.
Monitor the performance of HYG. A close above 82.38 would be bullish for U.S. Equities.
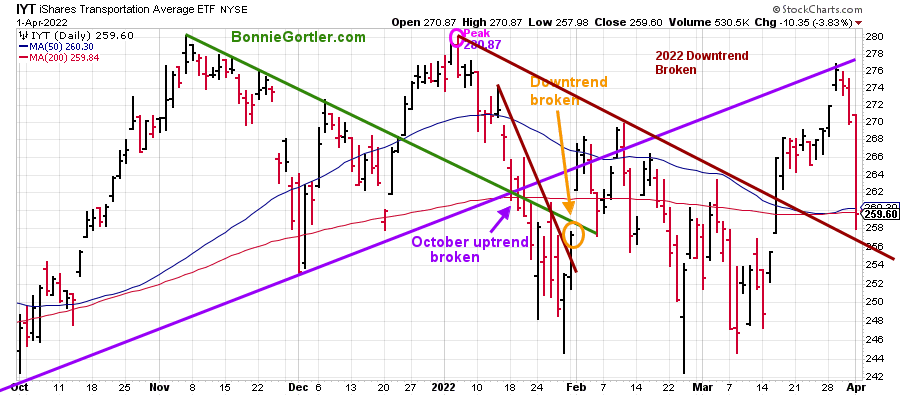
Figure 13: iShares Transportation Average (IYT)
40122 Daily IYT
Source: Stockcharts.com
IYT failed to make a new high and made a sharp reversal lower this past week. It would be positive if IYT holds above 255.00 and turns up.
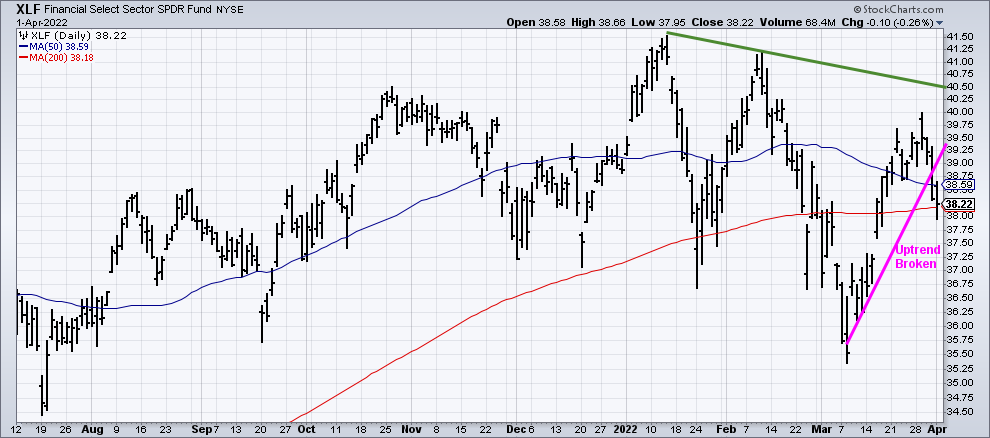
Figure 14: Financial Select SPDR (XLF)
40122 Daily XLF
Source: Stockcharts.com
Warning: Financials broke its March uptrend and are close to giving a MACD sell.
The Transportation Average (IYT) and Financials (XLF) fell sharply last week, which is disturbing. Both sectors need to rise early in the week to support the broad market.
Summing Up:
Quarter-end rebalancing puts a damper on the rise. The major averages stalled, unable to get through overhead resistance. Semiconductors, Financials, and Transports fell sharply. Strength in market breadth is needed for the rally to be sustainable in the second quarter. Keep a close eye on small-cap stocks if they can show strength compared to the S&P 500 and if IWM can close above 212.50.
Remember to manage your risk, and your wealth will grow.
If you liked this article, you will love my Free Grow and Sustain Your Wealth Report. Get it here:

Do you like charts, I invite you to my FB group Wealth Through Market Charts or email me at Bonnie@Bonniegortler.com.
I would love to hear from you. If you have any questions or comments or would like to talk about the market, click here.
Disclaimer: Although the information is made with a sincere effort for accuracy, it is not guaranteed that the information provided is a statement of fact. Nor can we guarantee the results of following any of the recommendations made herein. Readers are encouraged to meet with their own advisors to consider the suitability of investments for their own particular situations and for determination of their own risk levels. Past performance does not guarantee any future results.


Create more wealth in your life
with these simple strategies.
As an added bonus you will also
receive BG’s Updates and Ezine

Discover how to quickly create more well-being in your life with these simple strategies.
As an added bonus you will also
receive BG’s Updates and Ezine

As an added bonus you will receive BG’s Updates and Ezine

All work listed on BonnieGortler.com is licensed under a Creative Commons Attribution - Noncommercial - No Derivative Works 3.0 Unported License.


Free Report:
Grow and Sustain Your Wealth
Discover how to grow your money with these easy, simple steps.

