

10 Simple Tips for Financial Well-Being
07/01/2026
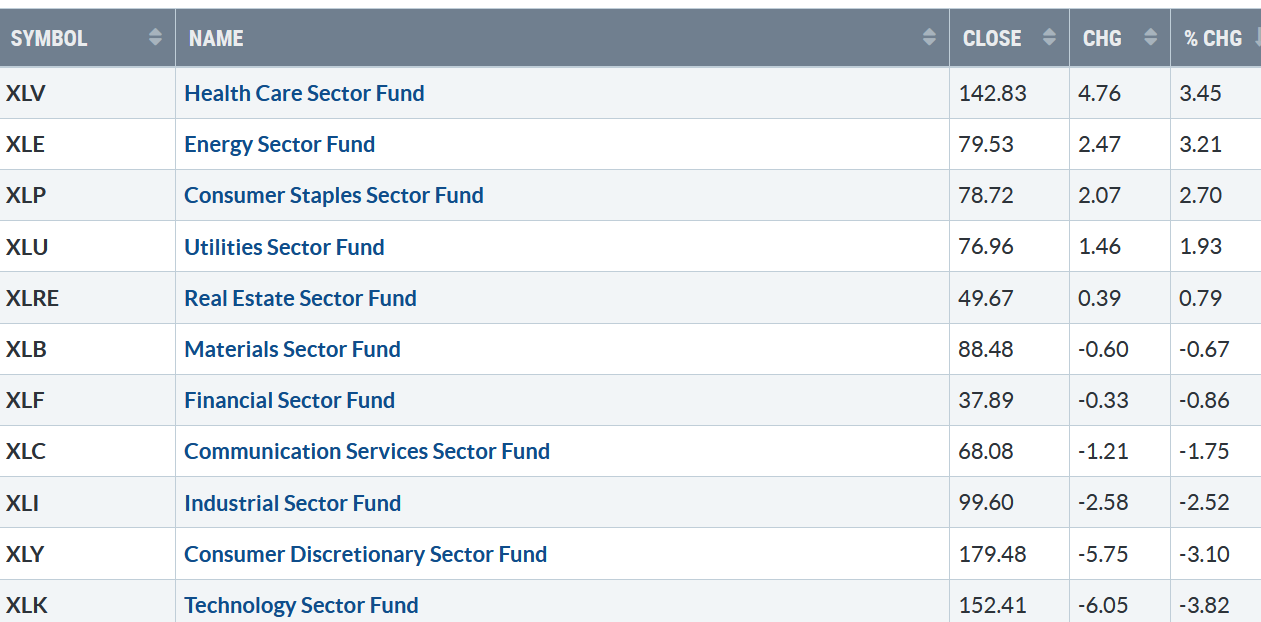
A sharp rise in interests rates triggered heavy selling throughout the week. Defensive sectors gained interest as investors rotated into Value and away from Growth. Five of the eleven sectors rose last week. Health Care (XLV) and Energy (XLE) were the best performing sectors, while Consumer Discretionary (XLY) and Technology (XLF) were the weakest. The SPDR S&P 500 ETF Trust (SPY) was down -1.18%.
4/1/22 – 4/8/22
S&P SPDR Sector ETFs Performance Summary
40822 SPDR Sectors
Source: Stockcharts.com
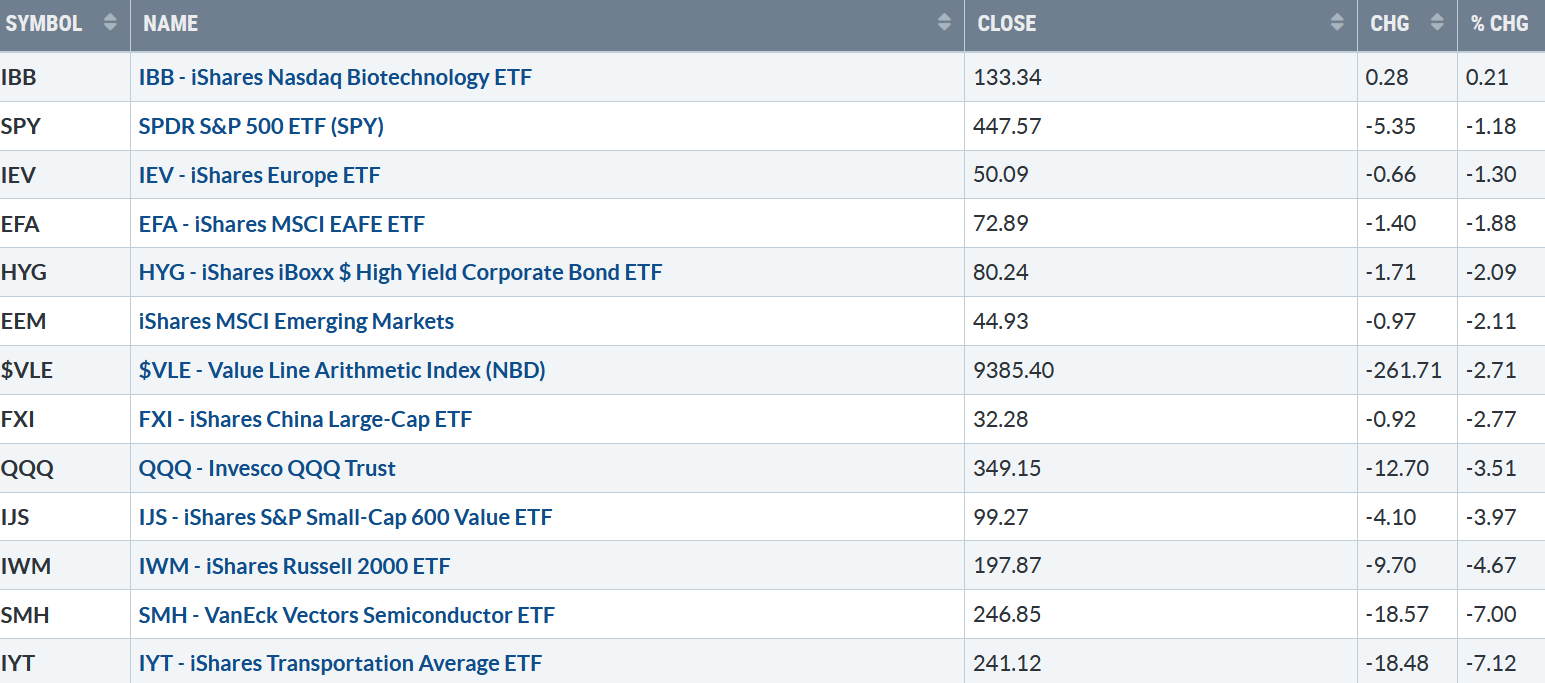
Figure 2: Bonnie’s Mix of ETFs To Monitor
Performance Summary 4/1/22 – 4/08/22
040822 Week ETFs
Source: Stockcharts.com
Biotechnology was the only winner in my favorite ETFs. Hi Yield and global markets were weak after showing signs of life. Transportation and Semiconductors were clobbered, continuing the previous week’s decline. Watch the tape action in these sectors closely if and when they stabilize. Until they do so, these high sectors are in jeopardy of further decline.
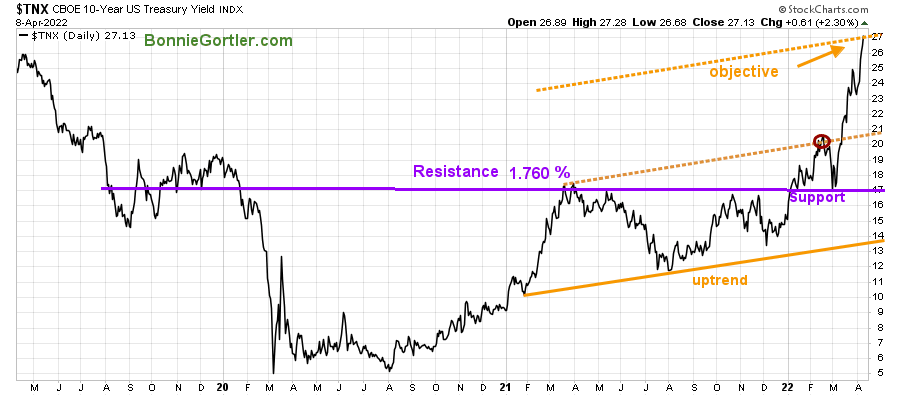
Figure 3: UST 10 YR Bond Yields Daily
40822 UST 10YR Bond Yields Daily
Source: Stockcharts.com
The 10-Year U.S. Treasury yields continued to climb last week to three-year highs closing at 2.713%, reaching my upside objective.
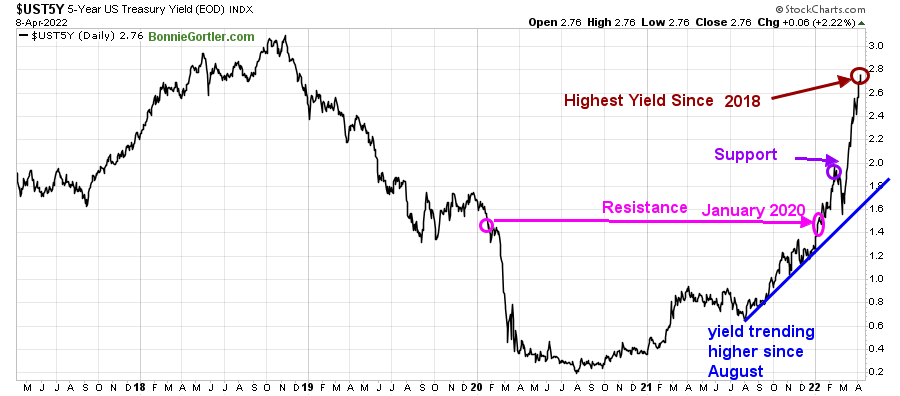
Figure 4: UST 5 YR Bond Yields Daily
40822 UST 5 YR Bond Yields Daily
Source: Stockcharts.com
The 5 Year U.S Treasury yields increased to the highest yield since 2018, closing at 2.76%.
The Dow fell -0.28% for the week, the least of the major averages. The S&P 500 fell -1.27%, Nasdaq fell -3.86%, the Russell 2000 Index down -4.62 %, and the Value Line Arithmetic Index (a mix of approximately 1700 stocks fell -2.71%.
Weekly market breadth was negative for the New York Stock Exchange Index (NYSE) and Nasdaq. The NYSE had 1086 advances and 2469 declines, with 249 new highs and 462 new lows. There were 1683 advances and 3640 declines on the Nasdaq, with 252 new highs and 579 new lows. Poor market breadth makes it much hard for a rally to be sustainable.
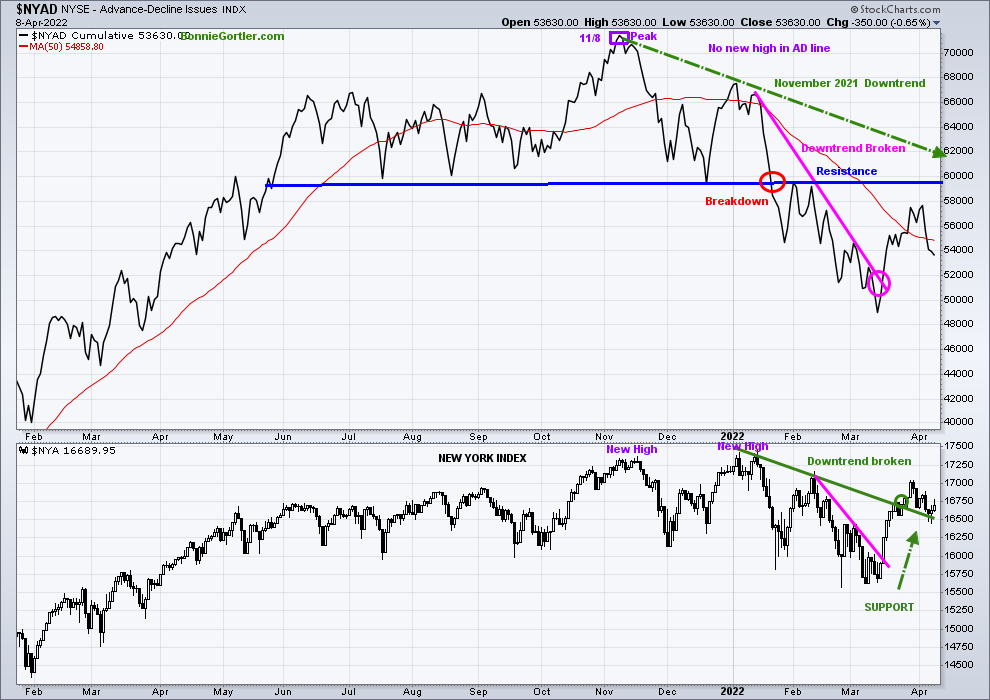
Figure 5: NYSE Cumulative Advance-Decline Line (Top) and NYSE Index (Bottom)
40822 NYSE Price CUM AD-LINE
Source: Stockcharts.com
The New York Index made a new high in November 2021 and in January 2022 (bottom chart), unconfirmed by the NYSE AD line, which peaked on 11/8/21 (purple rectangle top chart).
The NYSE A/D Line remains in a downtrend (green dotted line top chart).
In March, the AD Line and New York Index broke their downtrends (pink line top and bottom chart). Its negative breadth has weakened in April, turning down failing to get above resistance (blue line top chart). Improved market breadth is needed for a rally in the second quarter of 2022 to be sustainable. Keep a close eye.
Figure 6: CBOE Volatility Index VIX

40822 Daily VIX
Source: Stockcharts.com
The CBOE Volatility Index ($VIX), a measure of fear, has been trading above 20.00 for most of 2022. In January, VIX made a high at 31.96 on 1/26 (brown circle), on 3/1 at 33.32 (red circle), and 36.95 on 3/7 (blue circle).
VIX rose, closing at 21.16 on 4/8, after falling below 20 on 4/01 (orange circle) at 19.63, implying day-to-day volatility will likely increase. If VIX closes above 24.00, the market will likely accelerate lower.
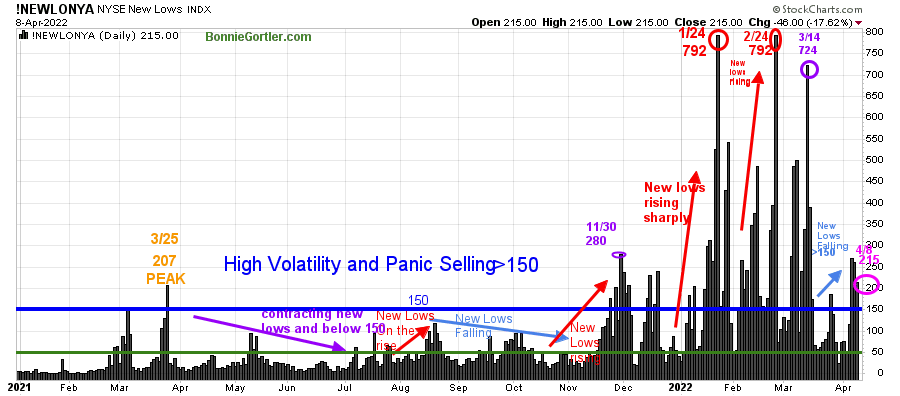
Figure 7: Daily New York Stock Exchange (NYSE) New Lows
40822 Daily NYSE NEW LOWS
Source: Stockcharts.com
Watching New lows on the New York Stock Exchange is a simple technical tool that helps awareness of the immediate trend’s direction.
New lows warned of a potential sharp pullback, high volatility, and “panic selling” for most of 2022, closing above 150. Learn more about the significance of New Lows in my book, Journey to Wealth, published on Amazon. Here is an excerpt, when new lows are above 150, the market is negative, higher risk, and selling is taking place. Sometimes it could be severe, and sometimes on a very nasty day, you can have “panic selling,” and big wild swings (high volatility) to the downside may occur.
As the market sold off in January, New Lows rose sharply, peaking at 792 on 1/24 (red circle), and then contracted but not enough to be in a low-risk zone before rising again on 2/24 at 792, matching the 1/24 peak. In March, New lows fell below 150, and a short-term rally began. However, once again, they are rising, which is worrisome.
New Lows closed at 215 on 4/8 (pink circle), above 150 again, not a positive sign in the near term. Risk is high of further downside in the near term until they contract to below 150 and then between 25 and 50.
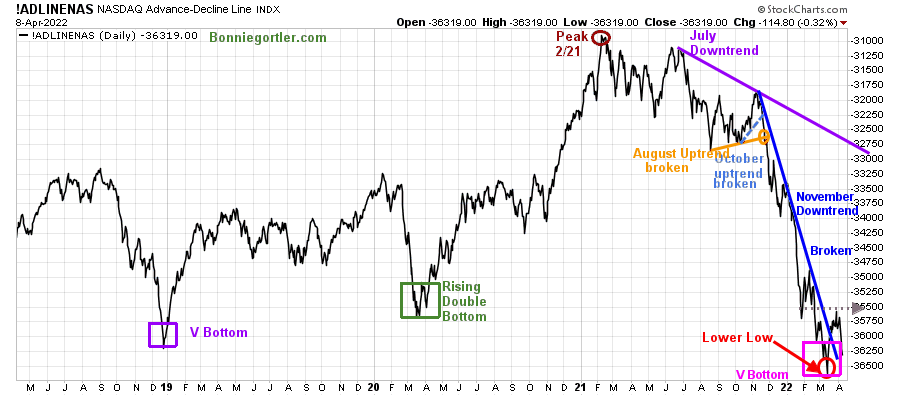
Figure 8: Daily Nasdaq Advance-Decline Line
40822 Nasdaq Ddaily AD-LINE
Source: Stockcharts.com
The daily Nasdaq advance-decline line peaked in February 2021 (brown circle), followed by failed attempts to make a new high. After breaking the October uptrend (blue dotted line), the Nasdaq AD-Line made a series of lower highs and lower lows in November, December, and January and trended down.
The July 2021 downtrend (purple line) remains. After making a lower low earlier in the month, a V bottom identical to December 2019 (purple rectangle) has formed. The downtrend from November (blue) penetrated is a positive sign that the worst of the decline is over. However, with last week’s negative breadth, the AD line turned down yet again. Further weakness below the low would be bearish and imply a potential of a new leg down
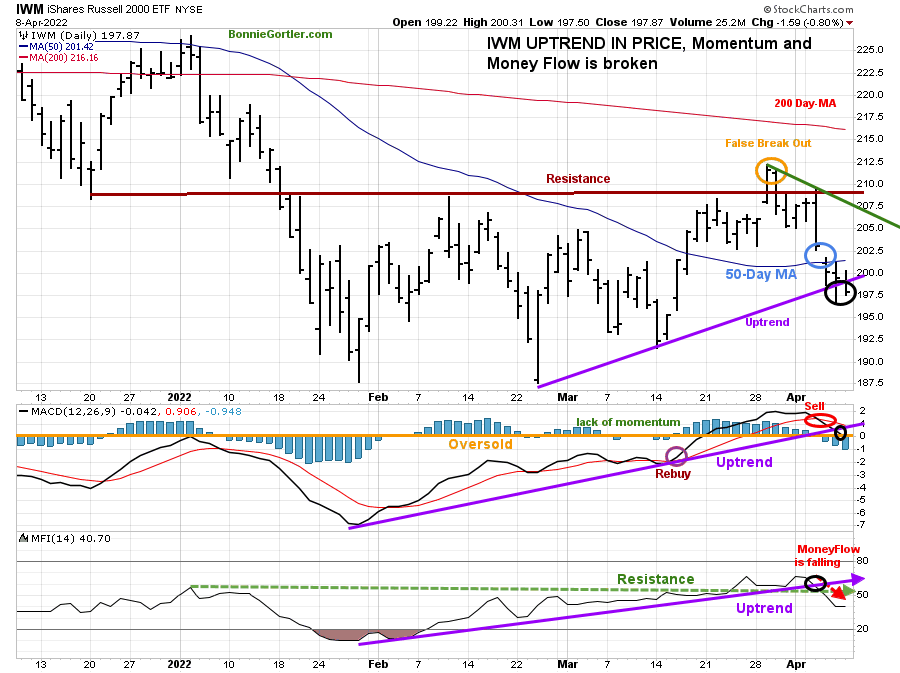
Figure 9: Daily iShares Russell 2000 (IWM) Price (Top) and 12-26-9 MACD (Middle) and Money Flow (Bottom)
40822 Daily IWM
Source: Stockcharts.com
The top portion of the chart is the daily iShares Russell 2000 Index ETF (IWM), the benchmark for small-cap stocks, with a 50-Day Moving Average (MA) (blue line) and 200-Day Moving Average (MA) that traders watch and use to define trends.
IWM had the potential to break out to the upside. In late March, IWM had a failed breakout above resistance at 210.00 (orange circle). Last week IWM gapped down below the 50-Day MA (light blue circle) and then broke below the uptrend (purple line), finishing the week -4.67% at 197.87 (black circle).
Short-term resistance is 200.00, 205.00, 210.00, and 212.50. Support is at 195.00 and 192.00.
MACD (middle chart) is on a sell, Money Flow (lower graph) broke the uptrend and is flat.
It’s bearish that the IWM uptrend in Price, Momentum, and Money Flow broke to the downside.
NOTE: IWM for the intermediate term (weekly chart not shown) stalled under resistance after generating a buy last week, unable to penetrate the March downtrend confirming the buy.
Caution is recommended until price, momentum, and money flow stop falling and turn up.
More trouble ahead for Nasdaq?
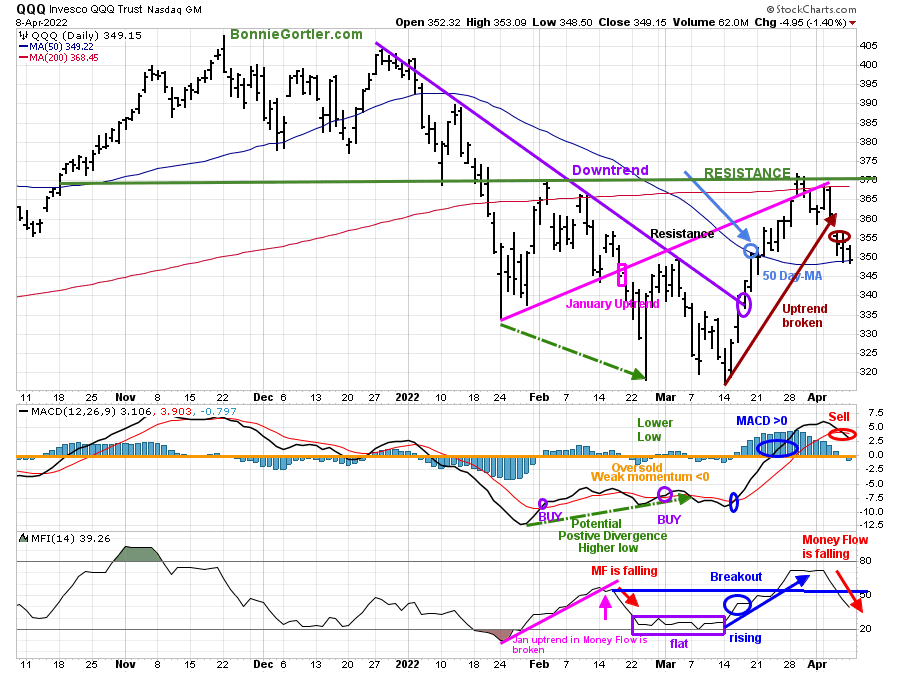
Figure 10: Daily Invesco QQQ Trust (QQQ) Price (Top) and 12-26-9 MACD (Bottom)
40822 Daily QQQ
Source: Stockcharts.com
The chart shows the daily Invesco QQQ, an exchange-traded fund based on the Nasdaq 100 Index with its 50 and 200-Day Moving Average. QQQ accelerated lower after breaking the January uptrend (pink rectangle), penetrating the January lows, then stalled at 351.00 resistance in early March and turned lower.
Last week QQQ fell -by 3.51%, closing at 349.15. QQQ closed slightly below its 50-Day MA after stalling below 370.00 resistance early in the week, coinciding with the 200-Day Moving Average.
The short-term trend is now down after breaking the March uptrend (brown line) at 355.00.
Resistance remains at 360.00, 370.00, and 375.00, and support is at 345.00 and 340.00.
The middle chart is MACD (12, 26, 9), a measure of momentum; MACD flipped from buy to sell last week.
Money Flow (lower chart) is now falling after breaking out of its sideways trading range to its highest level since November 2021.
With the short-term trend changing to down, caution is recommended until price, momentum, and money flow turn up.
Figure 11: Van Eck Semiconductors (SMH) Daily Price (Top), 12-26-9 MACD (Middle), and Money Flow (Bottom)

40822 Daily SMH
Stockcharts.com
SMH in 2022 has been volatile. In late January, support was broken (red circle) and then fell sharply but held the October 2021 lows. SMH then rallied but turned down again, closing below support at 240.00 on 3/14/22, a false breakdown.
Continued underperformance in SMH compared to QQQ gave a warning of pending weakness. SMH broke the March uptrend (redline) the previous week after failing to get above resistance and fell sharply for a second week in a row, down -7.00%, closing at 246.85, below the 50 and 200-Day Moving Average.
Support is at 242.00, 220.00, and 210.00. Resistance is at 265.00 and 275.00, followed by 290.00.
MACD (middle chart) generated a sell (red circle), and Money Flow (lower chart) broke its uptrend and is falling. With the short-term trend changing to down, SMH is likely to test the March lows early next week until MACD and Money Flow stop falling; it’s risky to bottom fish at this time.
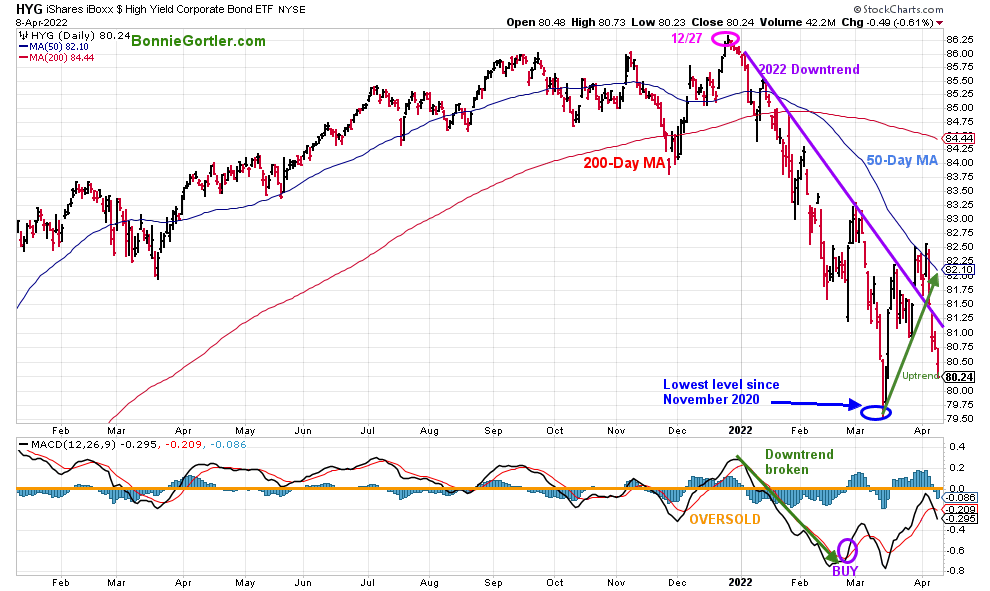
Figure 12: I Shares Hi Yield Corporate Bond (HYG) (Top), and 12-26-9 MACD (Bottom)
Source: Stockcharts.com
Hi-Yield Bonds (HYG) peaked on 12/27/21 and appeared to stabilize in late February but reversed lower, reaching their lowest level since November 2020 (blue circle).
HYG failed to get through the 50 Day MA last week and had no follow through to its previous week’s gains after breaking the downtrend, closing at 80.24 down -2.09%,
Monitor the performance of HYG. A potential double bottom could occur if HYG shows strength and closes above 81.50 and then 82.10.
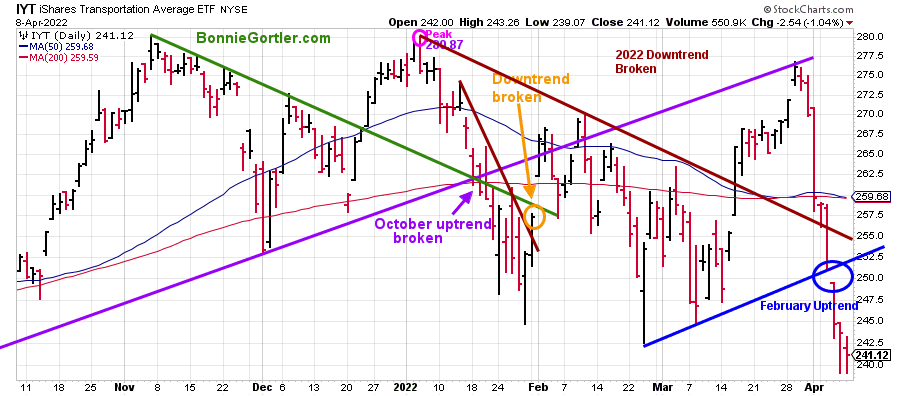
Figure 13: iShares Transportation Average (IYT)
40822 Daily IYT
Source: Stockcharts.com
IYT failed to make a new high the previous week and then reversed sharply. Investors continued selling this past week breaking the February uptrend (blue line) as IYT decline accelerated, down -7.12%.
Until IYT closes to at least 245.00, more selling is likely, potentially to as low as 214.00.
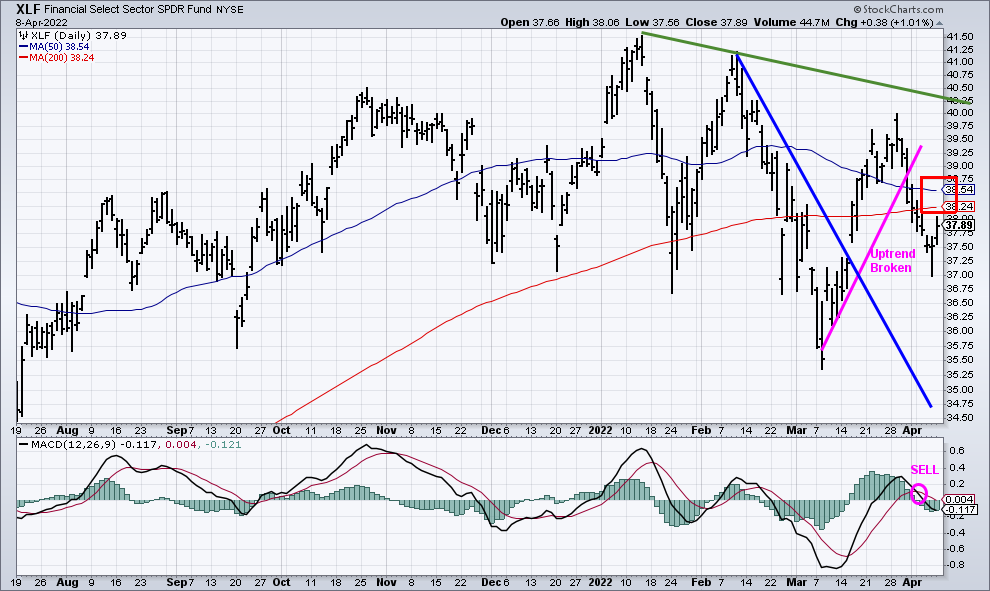
Figure 14: Financial Select SPDR (XLF) (Top) and 12-26-9 MACD (Bottom)
40822 Daily XLF
Source: Stockcharts.com
The short-term trend remains down after breaking its March uptrend (pink line) and closing below both its 50 and 200 Day- MA.
Even though rates rose, Financials (XLF) fell by – 0.86% last week.
MACD is on sell. Until XLF trades above 38.75 and MACD turns up, the risk remains of further downside. Also, this week’s earnings will be reported by J.P Morgan, Goldman Sachs, and Citibank could add to volatility for the Financial sector.
Summing Up:
Investors chose defensive sectors led by Healthcare, Staples, and Utilities. Market breadth weakened, and short-term uptrends broke down after stocks failed to get above resistance. Favorable momentum patterns turned negative. Investors sold Technology, Small Cap Stocks, and Transports fell sharply as interest rates rose. Risk has increased of further decline in the near term until proven otherwise.
Remember to manage your risk, and your wealth will grow.
If you liked this article, you will love my Free Grow and Sustain Your Wealth Report. Get it here:

Do you like charts, I invite you to my FB group Wealth Through Market Charts or email me at Bonnie@Bonniegortler.com.
I would love to hear from you. If you have any questions or comments or would like to talk about the market, click here.
Disclaimer: Although the information is made with a sincere effort for accuracy, it is not guaranteed that the information provided is a statement of fact. Nor can we guarantee the results of following any of the recommendations made herein. Readers are encouraged to meet with their own advisors to consider the suitability of investments for their own particular situations and for determination of their own risk levels. Past performance does not guarantee any future results.


Create more wealth in your life
with these simple strategies.
As an added bonus you will also
receive BG’s Updates and Ezine

Discover how to quickly create more well-being in your life with these simple strategies.
As an added bonus you will also
receive BG’s Updates and Ezine

As an added bonus you will receive BG’s Updates and Ezine

All work listed on BonnieGortler.com is licensed under a Creative Commons Attribution - Noncommercial - No Derivative Works 3.0 Unported License.


Free Report:
Grow and Sustain Your Wealth
Discover how to grow your money with these easy, simple steps.

