

10 Simple Tips for Financial Well-Being
07/01/2026
Market Update 6/17/22
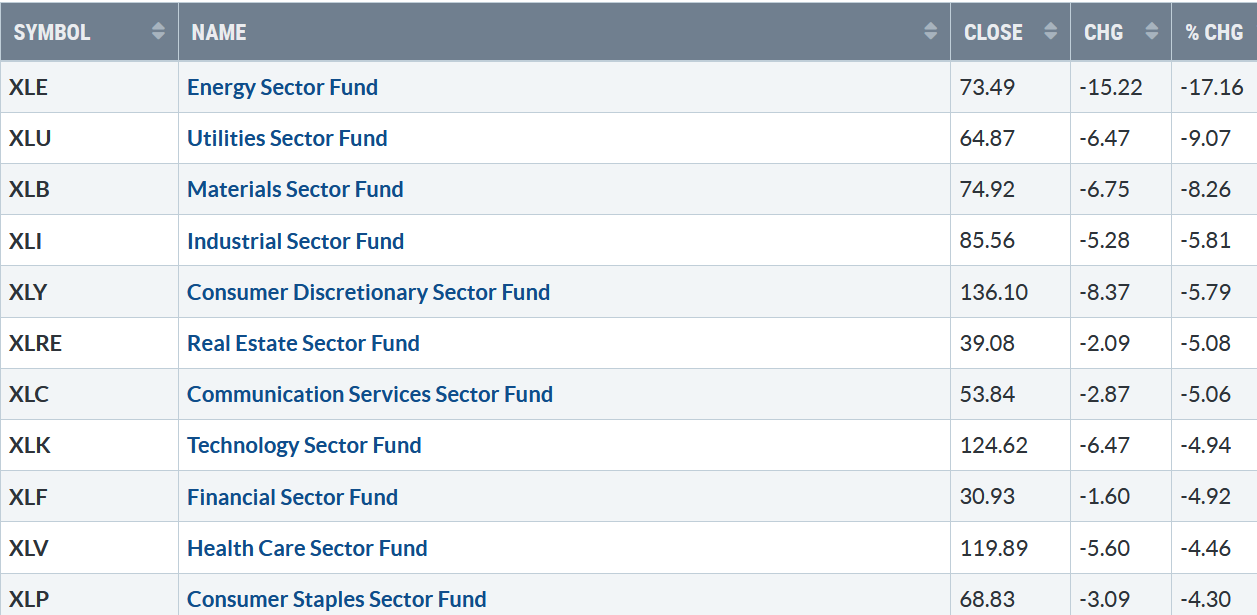
The decline accelerated, and all eleven S&P SPDR sectors were down last week. Energy (XLE) and Utilities (XLU) were the weakest sectors, while Healthcare (XLV) and Consumer Staples (XLP) fell the least. The SPDR S&P 500 ETF Trust (SPY) fell by -5.74%, closing at an 18-month low.
S&P SPDR Sector ETFs Performance Summary
6/10/22 – 6/17/22
61722 Sectors Wee
Source: Stockcharts.com
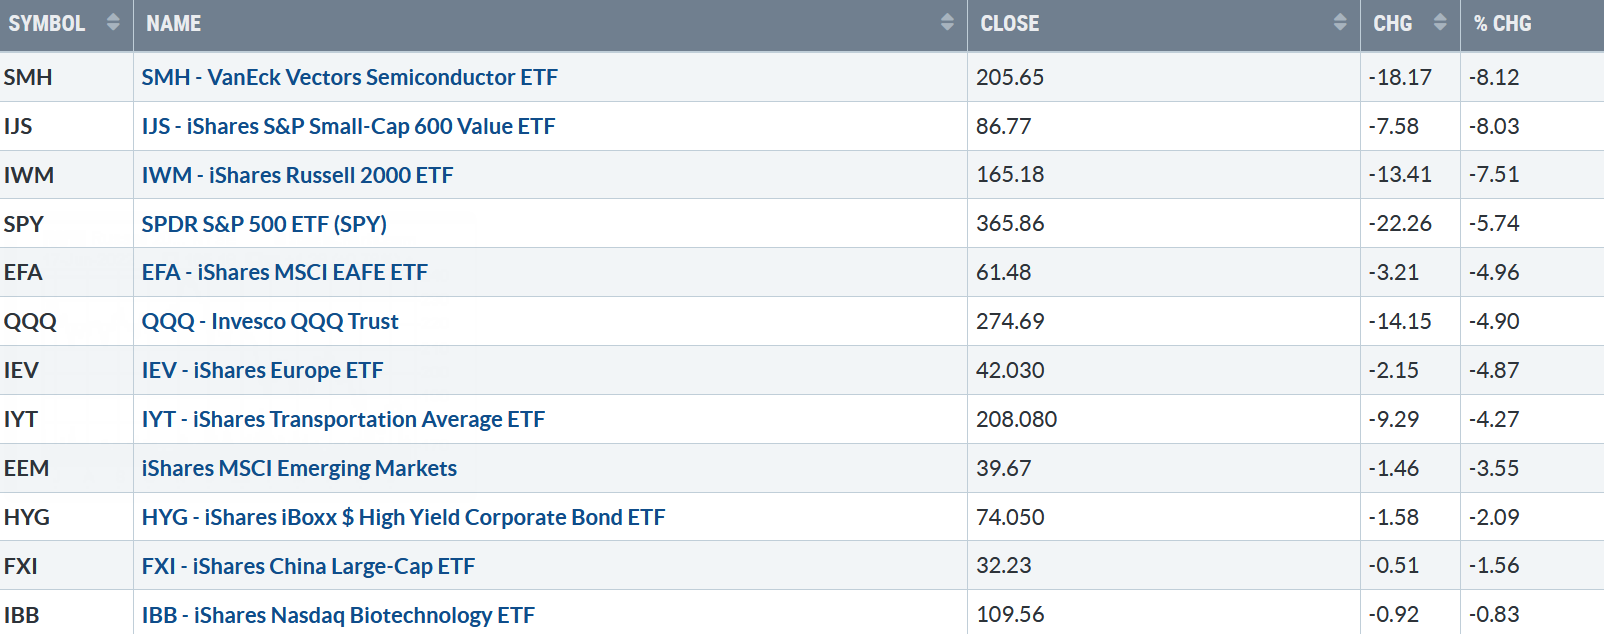
Figure 2: Bonnie’s Mix of ETFs
Performance Summary 6/10/22 – 6/17/22
61722 Week ETFs
Source: Stockcharts.com
The bears took control, and there was nowhere to hide; Semiconductors, Small Cap Value, and Small Growth were under heavy selling pressure and weaker than the S&P 500.
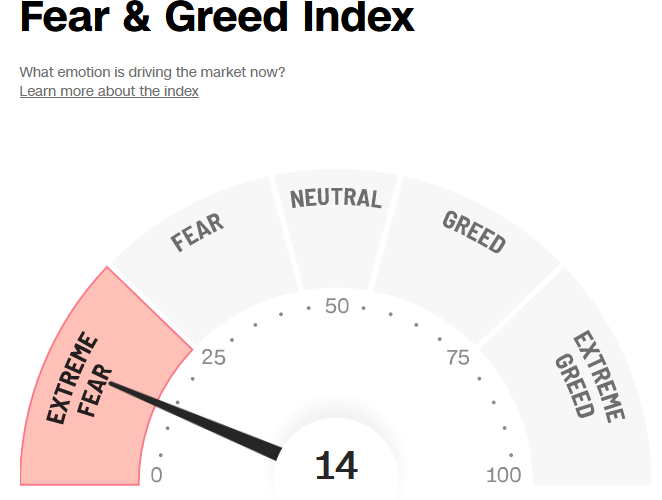
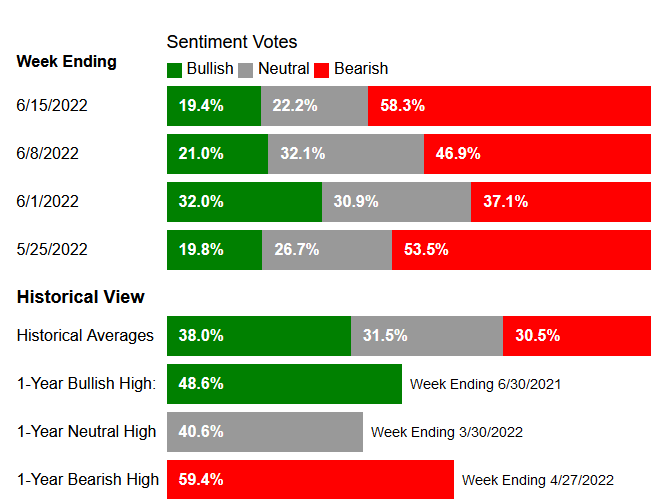
Market sentiment based on the CNBC Fear and Greed Index (a contrary indicator) fell to 14, showing extreme fear (Figure 3). The AAII Sentiment Survey (contrary indicator) with Bears jumped to 58.3%, continuing to show high pessimism (Figure 4).
Figure 3: Fear And Greed Index
61722 Fear and Greed Index
Source: Cnn.com
Figure 4: The AAII Sentiment Survey, week ending 6/15/22
61522 AAII Market Sentiment
Source https://www.aaii.com
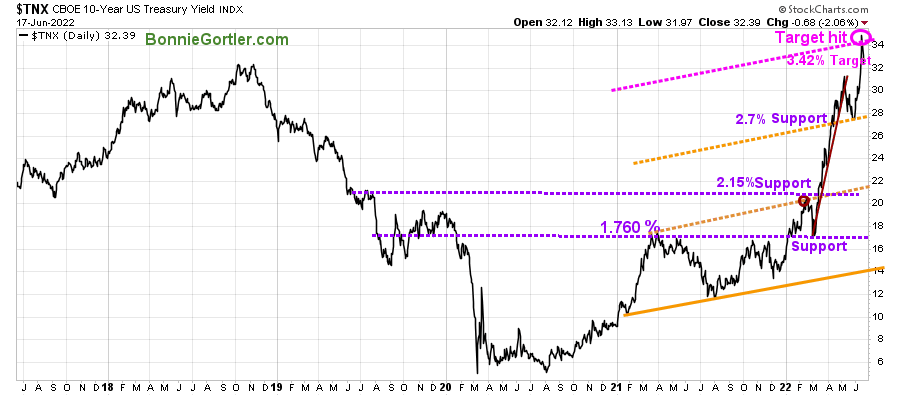
Figure 5: UST 10YR Bond Yields Daily
61722 UST 10 Yr Bond Yields Daily
Source: Stockcharts.com
The 10-Year U.S. Treasury yields rose, closing at 3.239%, fueling selling pressure in U.S. Equities, hitting the upside target of 3.42% intra-week.
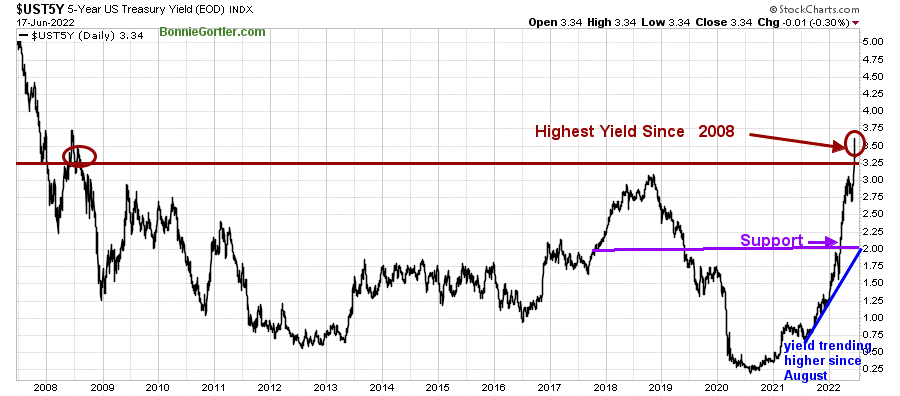
Figure 6: UST 5YR Bond Yields Daily
61722 UST 5 Yr Bond Yields Daily
Source: Stockcharts.com
The 5 Year U.S Treasury yield rose last week to the highest level since 2008, closing at 3.34%,
The Dow fell -4.79% down eleven weeks in the past twelve, below 30,000 for the first time since 12/2020 last week. The S&P 500 was down -5.79%, and the Nasdaq closed at its lowest level since August 2020, falling -4.78%, both down ten of the previous eleven weeks. The Russell 2000 Index declined -7.48%, while The Value Line Arithmetic Index (a mix of approximately 1700 stocks was lower by -7.36%.
Weekly market breadth was negative for the New York Stock Exchange Index (NYSE) and Nasdaq. The NYSE had 384 advances and 3179 declines, with 21 new highs and 801 new lows. There were 11169 advances and 4191 declines on the Nasdaq, with 102 new highs and 1957 new lows. Ugly market breadth yet again.
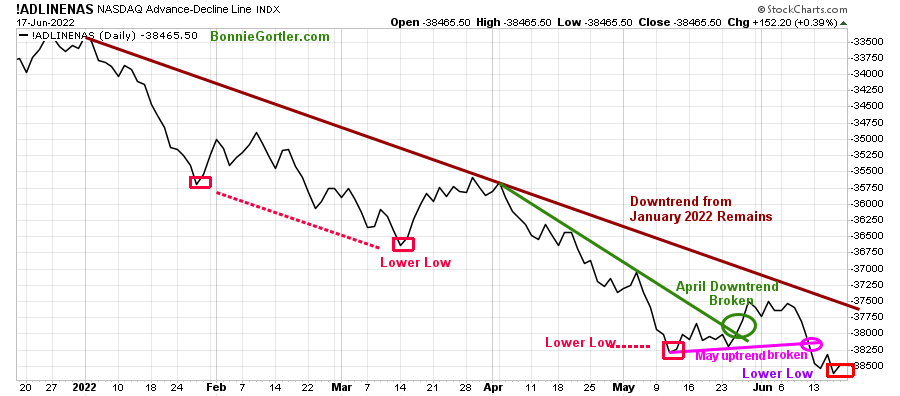
Figure 7: Nasdaq Advance Decline Line (Daily)
61722 Daily Nasdaq AD-Line
Source: Stockcharts.com
The improvement in breadth at the end of May and early June after breaking its April downtrend didn’t last for long,
Stocks sold off sharply, and market breadth deteriorated last week, breaking the May uptrend. For a sustainable rally that will last for the intermediate term (weeks to months), improvement in market breadth is necessary, ultimately breaking the January downtrend (brown line).
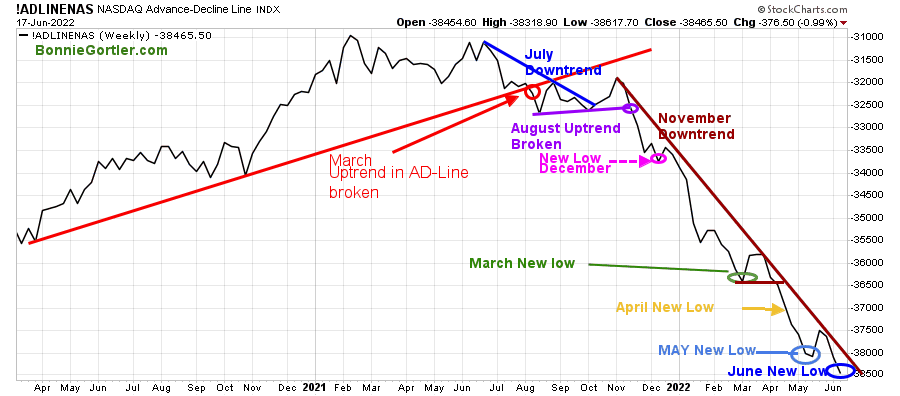
Figure 8: Nasdaq Advance Decline Line (Weekly)
61722 Weekly Nasdaq AD-Line
Source: Stockcharts.com
Weekly market breadth continues to make new lows and remains in its downtrend from November 2021.
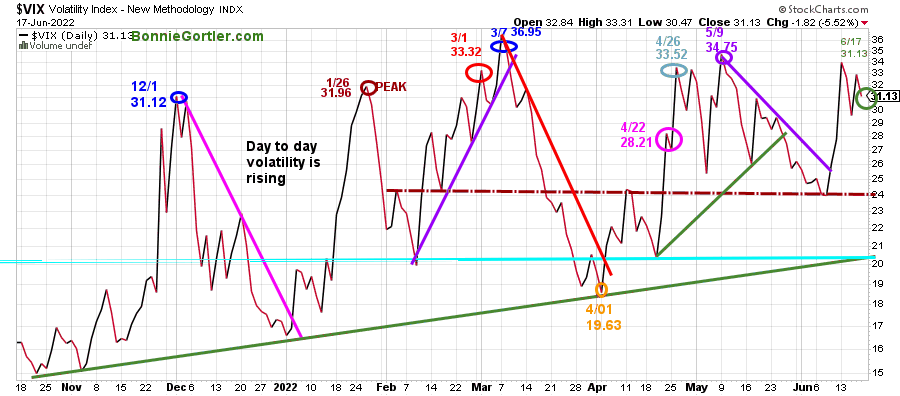
Figure 9: CBOE Volatility Index VIX
61722 VIX Daily
Source: Stockcharts.com
The CBOE Volatility Index ($VIX), a measure of fear, has been trading above 20.00 for most of 2022. In January, VIX made a high at 31.96 on 1/26 (brown circle), on 3/1 at 33.32 (red circle), and peaked at 36.95 on 3/7 (blue circle). VIX, through the sell-off, remained below the March peak.
VIX rose last week after breaking the May downtrend, the previous week closing at 31.13 (green circle), with fear increasing as the decline accelerated. However, we have yet to see panic where VIX rises above 40.00 or even 60.00 to imply a potential market bottom.
With VIX closing above 31.00, expect increased day-to-day volatility, including days with swings of 2-3% on the major averages.
On the other hand, intraday volatility will be less if VIX closes below 24.00, indicating a potential test of the 4/01 April low (orange circle) at 19.63.
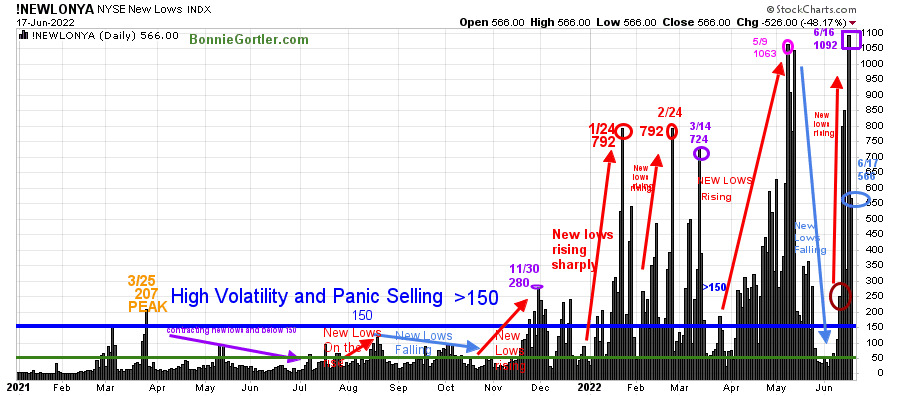
Figure 10: Daily New York Stock Exchange (NYSE) New Lows
61722 NYSE New LOWS Daily
Source: Stockcharts.com
Watching New lows on the New York Stock Exchange is a simple technical tool that helps awareness of the immediate trend’s direction.
New lows warned of a potential sharp pullback, high volatility, and “panic selling” for most of 2022, closing above 150. As the market started to move lower in January, New Lows rose sharply, peaking at 792 on 1/24 (red circle) and again on 2/24, implying an increased risk of further selling pressure. Investors in early May continued to unload stocks, and New Lows made a new high for 2022 of 1063 on 5/9 (pink circle).
Learn more about the significance of New Lows in my book, Journey to Wealth, published on Amazon. Here is an excerpt, when new lows are above 150, the market is negative, higher risk, and selling is taking place. Sometimes it could be severe, and sometimes on a very nasty day, you can have “panic selling,” and big wild swings (high volatility) to the downside may occur.
New lows rose last week, closing at 566 on 6/17 (light blue circle), after a new high for the year on 6/16 (purple rectangle), above the May peak (pink circle), a high-risk zone.
Risk remains of further downside in the near term until New Lows contract to below 150 and then fall between 25 and 50.
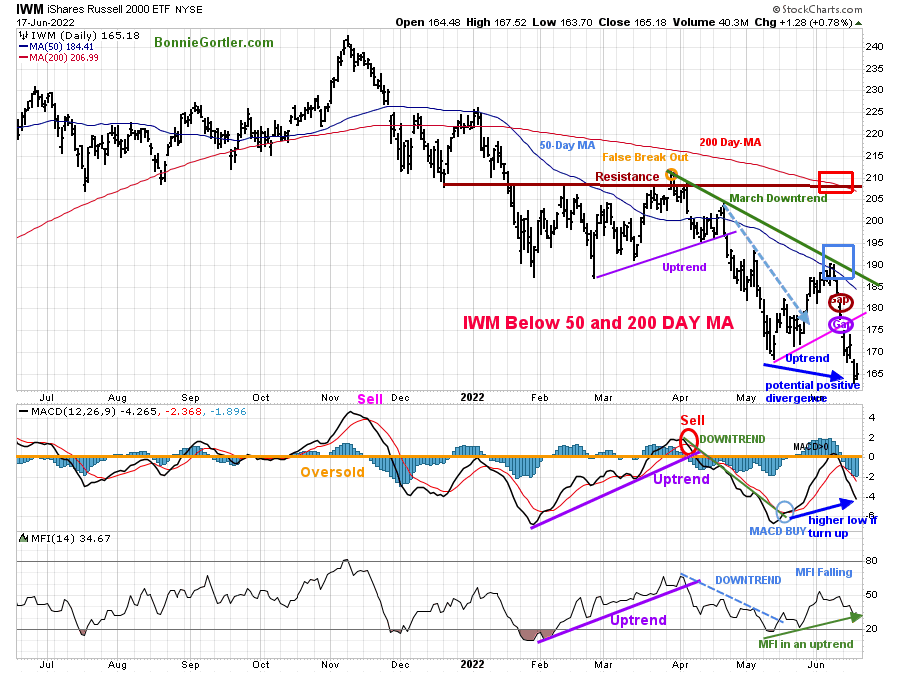
Figure 11: Daily iShares Russell 2000 (IWM) Price (Top) and 12-26-9 MACD (Middle) and Money Flow (Bottom)
61722 IWM Daily
Source: Stockcharts.com
The top portion of the chart is the daily iShares Russell 2000 Index ETF (IWM), the benchmark for small-cap stocks, with a 50-Day Moving Average (MA) (blue line) and 200-Day Moving Average (MA) that traders watch and use to define trends.
At the end of March, IWM failed to break out above resistance at 210.00 (orange circle) and turned sharply lower, forming a downtrend (green line).
The May uptrend (pink line) broke, followed by IWM gapping (purple circle) lower on Monday after heavy selling pressure the previous week. After IWM fell below support at 183.00, selling accelerated last week through support at 175.00, 173.00, and 170.00 levels mentioned in the Market Update 6/10, closing at 165.18, down -7.50%, remaining below the 50 and 200-Day Moving Averages (blue and red rectangle).
Short-term resistance is 170.00, 175.00, and 183.00. There is no support below on the daily chart. Sell stops likely sit below the lows on 6/16 of 162.78, which could fuel more selling.
MACD (middle chart) is on a sell and falling.
Money Flow (lower chart) broke the April downtrend (dotted blue line) but stalled quickly, now in jeopardy of breaking the May uptrend.
A potential positive divergence has formed. A sharp, quick bounce could occur. For more on MACD divergences, email Bonnie@BonnieGortler.com, and I will send you my article MACD Made Simple.
Not a pretty picture as of this writing, but this could change at any time when selling pressure subsides, and the bulls decide to come out of hiding.
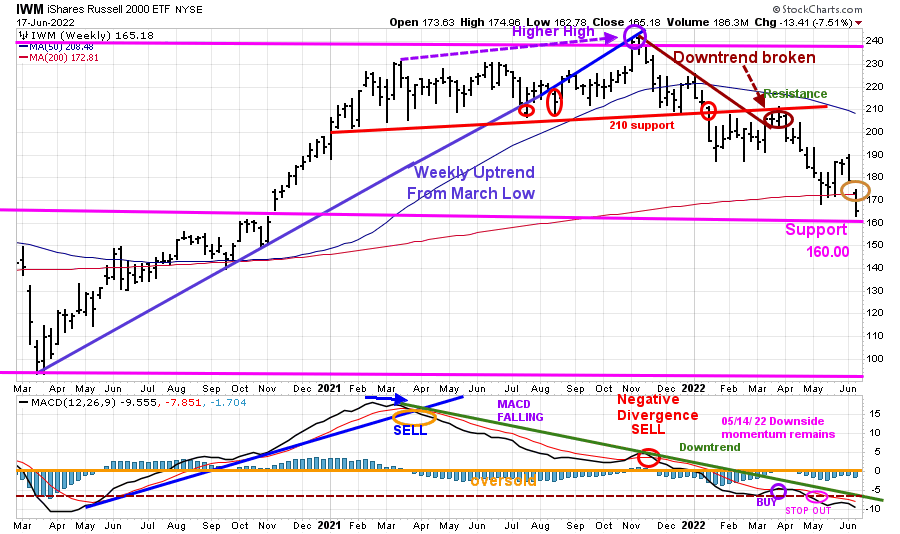
Figure 12: Weekly iShares Russell 2000 (IWM) Price (Top) and 12-26-9 MACD (Bottom)
61722 IWM Weekly
Source: Stockcharts.com
The top portion of the chart is the weekly iShares Russell 2000 Index ETF (IWM). After breaking the November downtrend in March (brown line), IWM stalled under resistance at 210.00 and turned down.
With no support on the daily IWM chart, it is critical that IWM stabilizes early in the week and closes above 173.00 on 6/24 to close above its 200-Week Moving Average, which was violated last week and avoid significant downside projections.
MACD (lower chart) is on a sell after a premature buy, followed by MACD making a lower low, implying downside momentum has not subsided.
Bottom fishing in IWM is risky until the MACD downtrend breaks, and IWM consistently outperforms the S&P 500 (SPY).
Figure 13: Daily Invesco QQQ Trust (QQQ) Price (Top) and 12-26-9 MACD (Bottom)
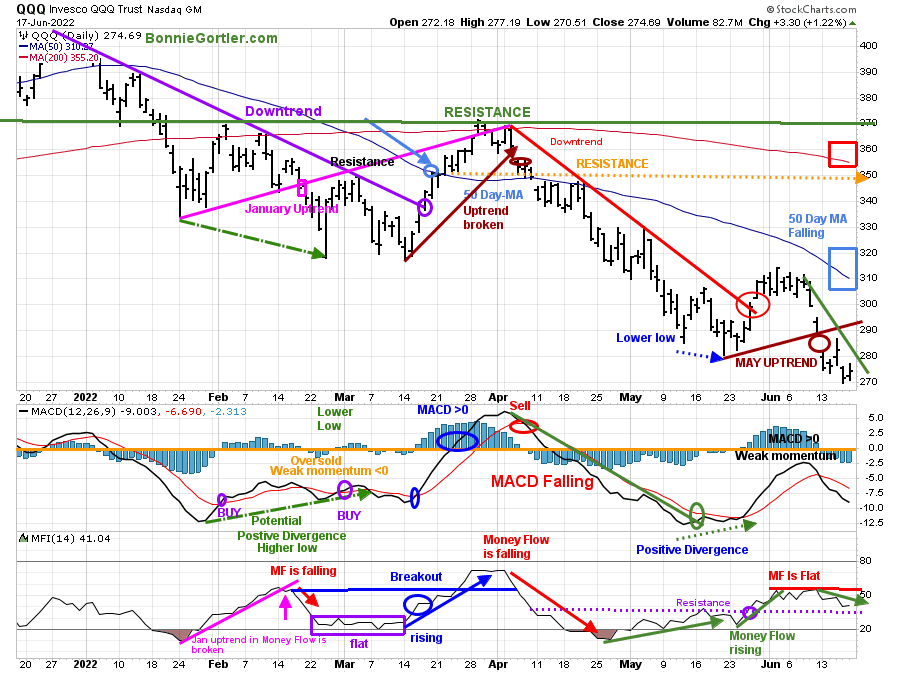
Source: Stockcharts.com
The chart shows the daily Invesco QQQ, an exchange-traded fund based on the Nasdaq 100 Index with its 50 and 200-Day Moving Average. QQQ accelerated lower after breaking the January uptrend (pink rectangle), penetrating the January lows. After breaking the March uptrend (brown line) at 355.00, QQQ declined sharply.
At the end of May, the short-term trend turned up after breaking the April downtrend (red line). QQQ had worked its way higher but stalled at 315.00 resistance. QQQ accelerated lower after a short-term consolidation on 6/9.
QQQ fell sharply, down -4.90%, closing at 274.69, after falling below the support of 285.00 and 280.00. QQQ remains below the 50-Day and 200-Day Moving Average.
Resistance is at 280.00, 295.00, and 310.00. There is no support below on the daily chart. Stops are likely sitting below the lows on 6/16 of 269.28. Selling is likely to continue. Note: The weekly downside target is 258.00. A close below would give new downside objectives.
The middle chart is MACD (12, 26, 9), a measure of momentum. MACD remains on a buy because MACD has not had enough strength to reach 0 for a sell to occur. However, weak momentum remains as MACD continues to fall.
Money Flow (lower chart) is falling and below resistance (purple dotted line).
From the Market Update, 6/10/22, to manage risk, 279.00 was used as a stop for those who had investments in QQQ. Note: Weekly QQQ MACD made a lower low.
Figure 14: Van Eck Semiconductors (SMH) Daily Price (Top), 12-26-9 MACD (Middle), and Money Flow (Bottom)
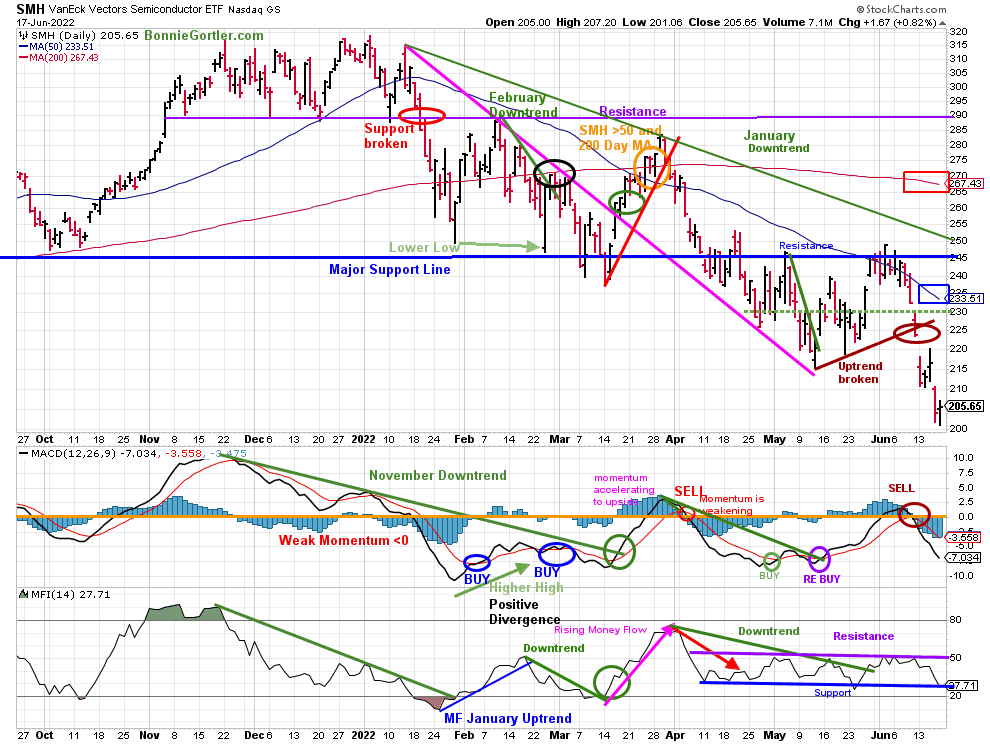
61722 SMH Daily
Stockcharts.com
In late January, SMH support was broken (red circle) and fell sharply but held the October 2021 lows. SMH then rallied but turned down again, closing below support at 240.00 on 3/14/22, a false breakdown. SMH broke the March uptrend (red line) after failing to get above the resistance at 290.00.
SMH fell -by 8.12% for the week after breaking the May uptrend the previous week, closing at 205.65 below the 50-Day (blue rectangle) and 200-Day MA (red rectangle).
SMH fell through support at 220.00 and 215.00 towards the downside target of 200.00. Resistance is 210.00 and 220.00, followed by 232.00.
MACD (middle chart) remains on a sell and is falling.
Money Flow (lower chart) turned lower after trending sideways since 4/11, unable to get over resistance (purple line), and now is at support (blue line).
Figure 15: Van Eck Semiconductors (SMH) Weekly
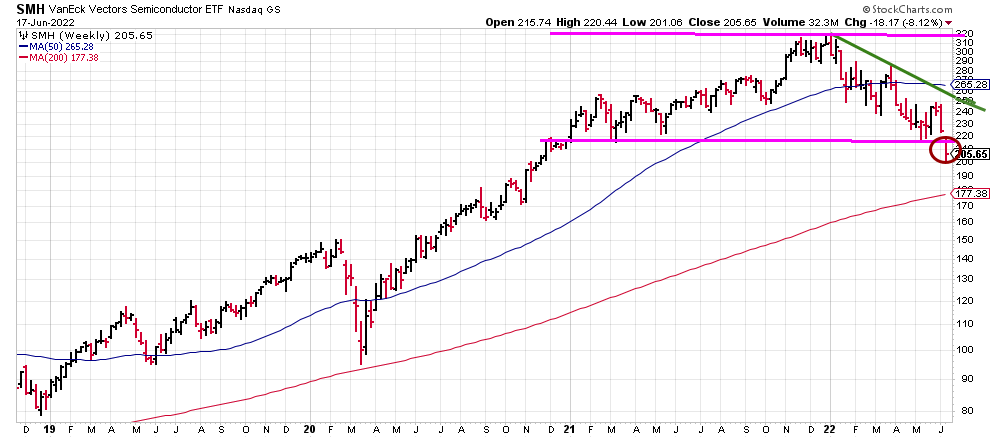
61722 SMH Weekly
SMH closed below its weekly channel support at 217.00. In sum, the bears remain in control.
Figure 16: I Shares Hi Yield Corporate Bond (HYG) (Top), and 12-26-9 MACD (Bottom)
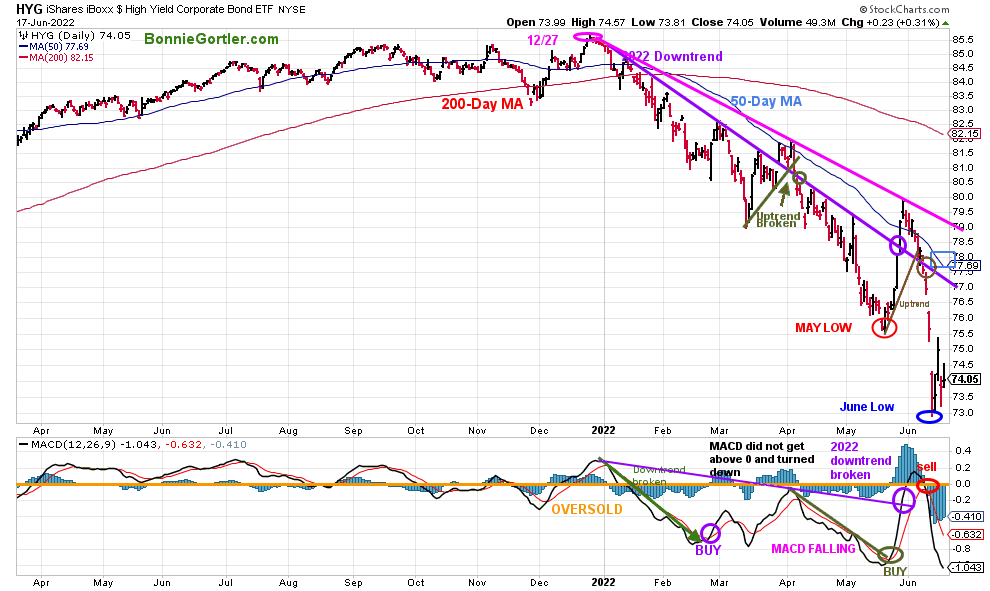
61722 HYG Daily
Source: Stockcharts.com
Hi-Yield Bonds (HYG) peaked on 12/27/21, and HYG broke the downtrend in early April (green line), which turned out to be a false breakout followed by a new low in May, and a sharp rally followed.
For the third week in a row, HYG fell, down -2.09%, closing at 74.05, accelerating lower after breaking the May uptrend (brown line), closing below its 50-Day MA.
MACD (lower chart) is on a sell
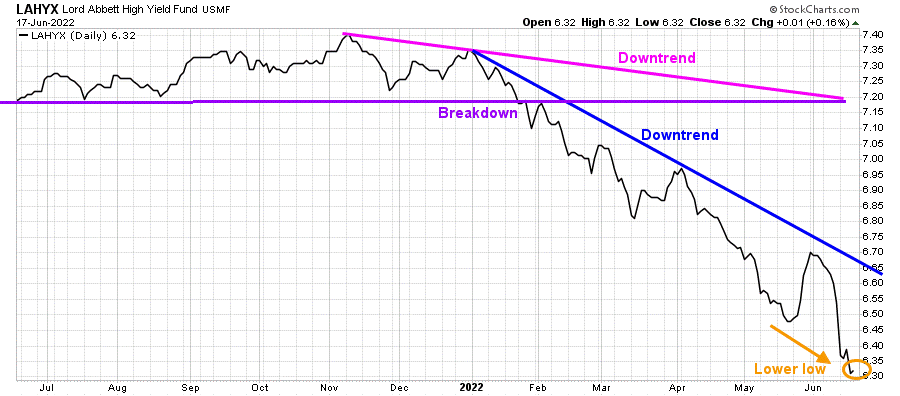
Figure 17: Lord Abbett High Yield Fund (LAHYX)
61722 LAHYX Daily
Source: Stockcharts.com
One of my favorite open-end Hi Yield mutual funds, Lord Abbett High Yield (LAHYX), had stabilized after making lower lows in May, but last week LAHYX confirmed the low in HYG. Continued weakness in HYG and LAHYX would be bearish for Equities and High Yield bonds.
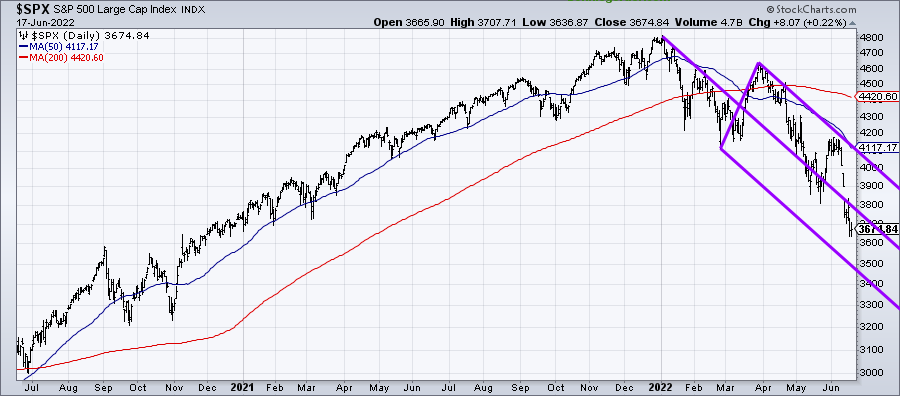
Figure 18: The S&P 500 Index Daily ($SPX)
61722 S&P 500 Daily
Source: Stockcharts.com
The S&P 500 (SPX) broke the downtrend (pink line) but stalled before hitting the short-term objective of 4276.00. What appeared to be a consolidation of the gains from the May low changed quickly to heavy selling after breaking through support at 3855.00 and the May low closing at 3674.84. Resistance is at 3850.00, followed by 4000.00 and 4200.00. The downside objective is 3500.00.
If you are interested in following this chart and other charts of interest, I invite you to join my FB group Wealth Through Market Charts, where I will post the updated chart during the week.
Figure 19: Energy SPDR Daily (XLE)

61722 XLE Daily
Source: Stockcharts.com
The strongest sector of 2022 Energy (XLE) joined in the decline, falling -by 17.16%, breaking its downtrend from December 2021. Support is at 70.00 (brown line), followed by 65.00 (pink line), and resistance is at 82.00.
Summing Up:
Over the last two weeks, extreme selling pressure-breaking short-term support tripping sell stops accelerating the decline. Continue to expect stock market volatility to remain high until downside momentum stabilizes. Cash is king until the tape improves. A bounce can occur any time, but more time is needed for a tradeable bottom to form. Therefore, it’s wise to focus on risk management and capital preservation.
Remember to manage your risk, and your wealth will grow.
If you liked this article, you will love my Free Grow and Sustain Your Wealth Report. Get it here:

Do you like charts, I invite you to my FB group Wealth Through Market Charts or email me at Bonnie@Bonniegortler.com.
I would love to hear from you. If you have any questions or comments or would like to talk about the market, click here.
Disclaimer: Although the information is made with a sincere effort for accuracy, it is not guaranteed that the information provided is a statement of fact. Nor can we guarantee the results of following any of the recommendations made herein. Readers are encouraged to meet with their own advisors to consider the suitability of investments for their own particular situations and for determination of their own risk levels. Past performance does not guarantee any future results.


Create more wealth in your life
with these simple strategies.
As an added bonus you will also
receive BG’s Updates and Ezine

Discover how to quickly create more well-being in your life with these simple strategies.
As an added bonus you will also
receive BG’s Updates and Ezine

As an added bonus you will receive BG’s Updates and Ezine

All work listed on BonnieGortler.com is licensed under a Creative Commons Attribution - Noncommercial - No Derivative Works 3.0 Unported License.


Free Report:
Grow and Sustain Your Wealth
Discover how to grow your money with these easy, simple steps.

