

10 Simple Tips for Financial Well-Being
07/01/2026
The Bears were the big winners this week, with all eleven S&P SPDR sectors finishing lower. Healthcare (XLV) and Utilities (XLU) were down the least, while Real Estate (XLRE) and the Consumer Discretionary Sector (XLI) were the weakest. The SPDR S&P 500 ETF Trust (SPY) was down -2.93%.
S&P SPDR Sector ETFs Performance Summary 9/15/23-9/22/23
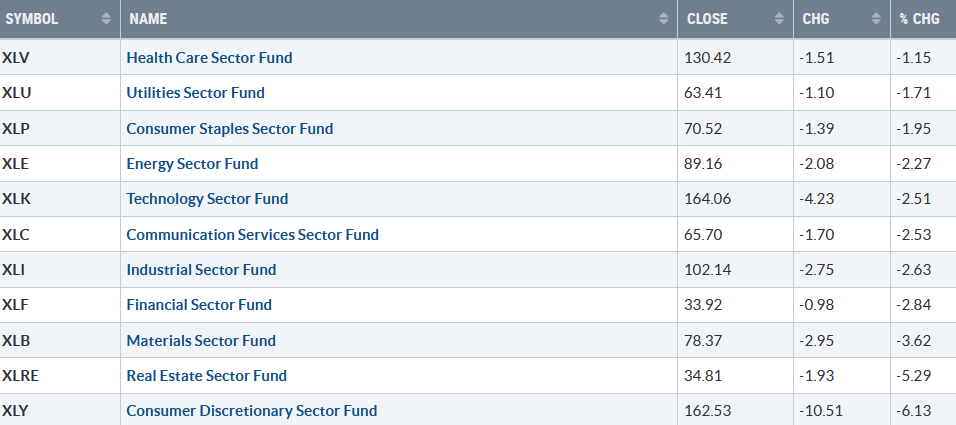
092223 SPDR Sectors
Source: Stockcharts.com
Figure 2: Bonnie’s ETFs Watch List Performance Summary 9/15/23-9/22/23
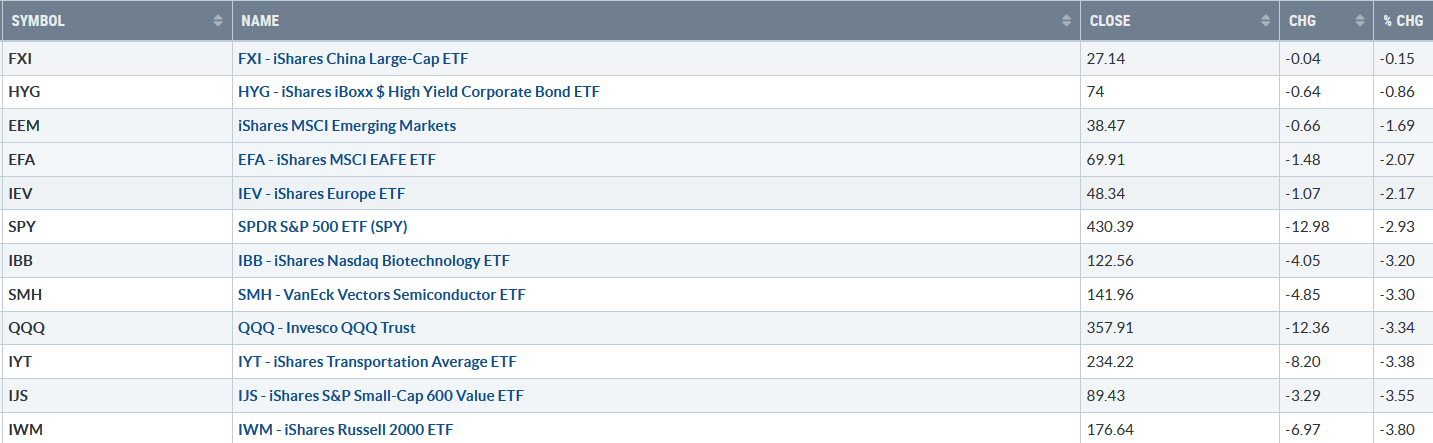
092223 SPDR SectorsSource: Stockcharts.com
Small Cap Value and Growth were again weak. Semiconductors, Technology, and Transports were all under selling pressure. China fell slightly, helped by Friday’s gains, while Hi Yield Bonds moved lower as investors reduced risk.
Where do we go from here?
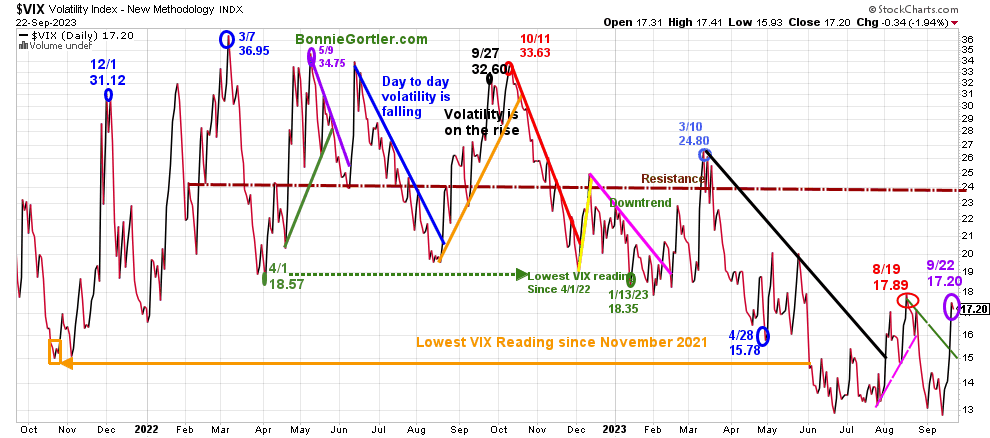
Figure 3: CBOE Volatility Index VIX
092323 VIX Daily
Source: Stockcharts.com
The CBOE Volatility Index (VIX), a measure of fear, traded above 20.00 for most of 2022, with a high at 36.95 on 3/7 (blue circle). A new VIX low did not occur until 1/13/23 at 18.35 (green circle) after peaking in October 2022 at 33.63 (red circle).
VIX rises as fear increases, closing at 17.20 (purple circle), the highest level since 8/19/23 at 17.89 (red circle), with the broad market weakening. A close above 20.00 would imply wider daily intraday swings and increased risk.
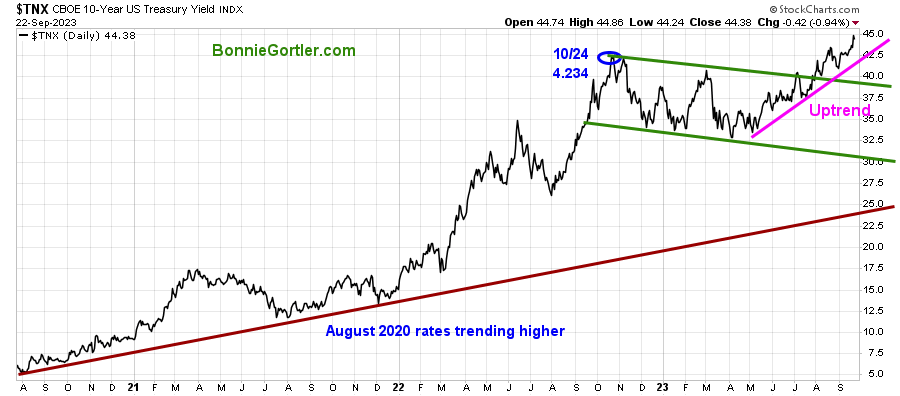
Yields continue to rise, pressuring equities.
Figure 4: UST 10YR Bond Yields Daily
092223 UST 10 Yr Bond Yields Daily
Source: Stockcharts.com
The 10-year U.S. Treasury yields continued to trend higher after last week’s Fed meeting, closing at 4.443%, remaining in the May uptrend (pink line). Further rise in yields is likely to put continued pressure on equities.
Last week, the major market averages were all lower. The Dow fell -1.89%, the S&P 500 was down -2.93%, the Nasdaq down -3.62%, while the Russell 2000 Index fell sharply -3.82%, the weakest market average, which is not a favorable sign for the near term.
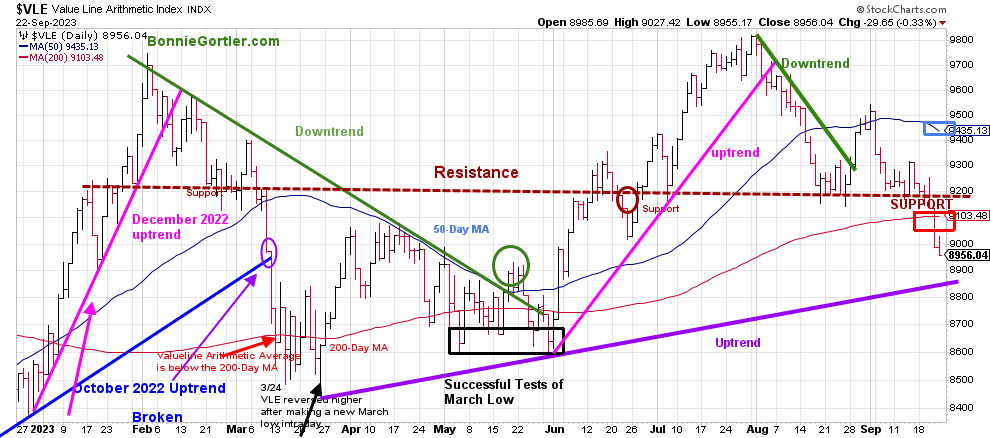
Figure 5: Value Line Arithmetic Average
0902223 VLE Daily
Source: Stockcharts.com
The Value Line Arithmetic Index ($VLE) is a mix of approximately 1700 stocks. VLE broke the October 2022 uptrend in early March (blue line), and April, May, and June had successful tests of the March low.
The decline was broad last week. VLE fell -2.98% below the 200-day MA (red rectangle), which has not penetrated since June, a sign of underlying weakness after failing at the 50-day MA in early September.
Resistance is 9100, 9200, and 9400. Support remains at 8850.
The uptrend is intact from March (purple line). However, two closes below 8850 would break the uptrend and be a warning the decline may accelerate further.
Do you want to go deeper into charting? Learn more In the comfort of your home today with my Free 33-minute Training, Charting Strategies to Cut Risk and Trade with the Trend. Sign up here.
Weekly market breadth was negative on the New York Stock Exchange Index (NYSE) and for the Nasdaq. The NYSE had 650 advances and 2373 declines, with 120 new highs and 303 new lows. There were 1212 advances and 3558 declines on the Nasdaq, with 161 new highs and 750 new lows.
Market breadth is concerning, with more stocks making weekly New Lows and fewer stocks making weekly New Highs on the NYSE and Nasdaq. For a broad rally to occur and be sustainable, breadth needs to be much better than it is.
If you want to go more in-depth with charts, I invite you to join my FB group Wealth Through Market Charts.
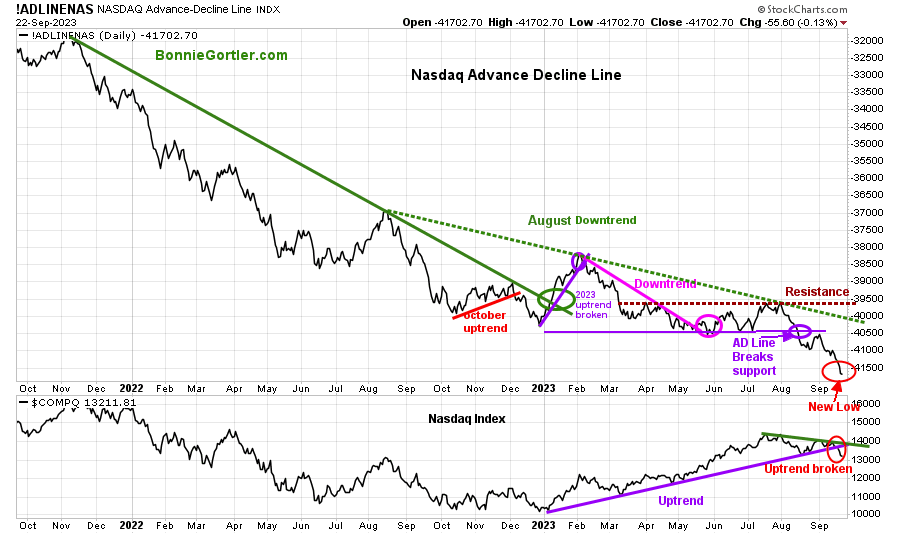
Nasdaq breadth remains worrisome
Figure 6: Nasdaq Advance Decline Line Daily (Top) and Nasdaq (Bottom)
092223 Daily Nasdaq Cumulative Advance-Decline Line
Source: Stockcharts.com
The top chart is the Nasdaq Daily Advance-Decline Line, a technical indicator that plots the difference between the number of advancing and declining stocks. In January 2023, the October 2022 downtrend was broken (solid green line) but quickly reversed lower in February 2023, when most of the stock participation was the large Mega Cap Stocks.
The AD-Line (top chart) broke support (purple circle) in August and remains weak, continuing to make new lows in 2023.
Last week, the Nasdaq (lower chart) broke the 2023 uptrend trend (purple line), which is negative and bears watching.
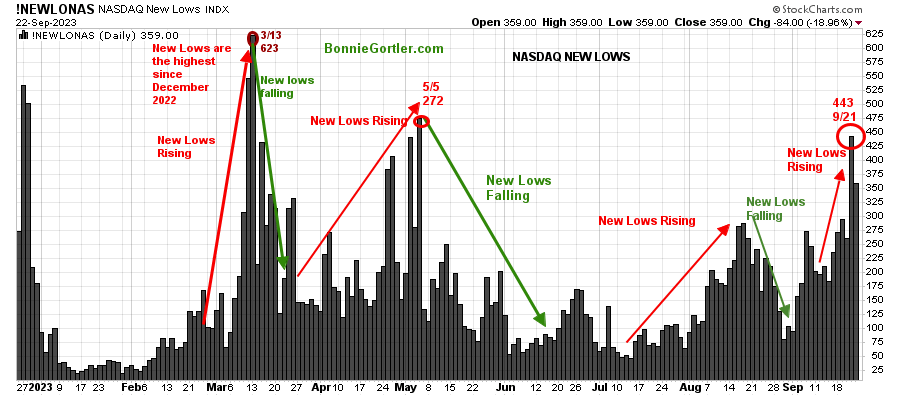
Warning: New Lows on the Nasdaq and NYSE are rising.
Figure 7: Daily Nasdaq New Lows
092223 Nasdaq New Lows Daily
Source: Stockcharts.com
Nasdaq New lows began to rise in September, closing at 359 last week. Nasdaq New Lows on 9/21 were the most since 5/5/23 when they were 272. Keep watching if New Lows expand or contract for a clue if the recent decline will continue or if they begin to contract, and a short-term reversal to the upside will occur.
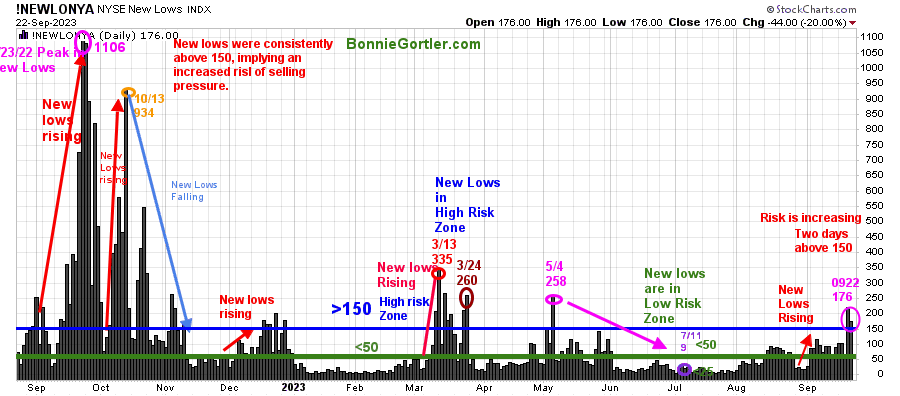
Alert: NEW LOWS ON THE NYSE are above 150.
Figure 8: Daily New York Stock Exchange (NYSE) New Lows
092223 NYSE New Lows Daily
Source: Stockcharts.com
Watching New Lows on the New York Stock Exchange is a simple technical tool that helps awareness of the immediate trend’s direction. New lows warned of a potential sharp pullback, high volatility, and “panic selling” for most of 2022, closing above 150. The peak reading was 9/23/22 when New Lows made a new high of 1106 (pink circle), and New Lows expanded to their highest level in 2023 on 3/13/23 (red circle) to 335.
New Lows have risen in September (red arrow on the right), closing at 176 (pink circle) now in the high-risk zone, above 150 for two consecutive days. If New Lows remain above 150, it would imply an increased risk of downside pressure in equities could accelerate. On the other hand, It will be favorable if the New Lows trend lower early in the week, falling below 150 and towards 50 and ultimately closing below 25 (the lowest risk zone), it would imply selling pressure subsiding and a buying opportunity ahead.
Learn more about the significance of New Lows in my book, Journey to Wealth, published on Amazon. If you would like a preview, get a free chapter here.
Figure 9: Dow Jones Industrial Average
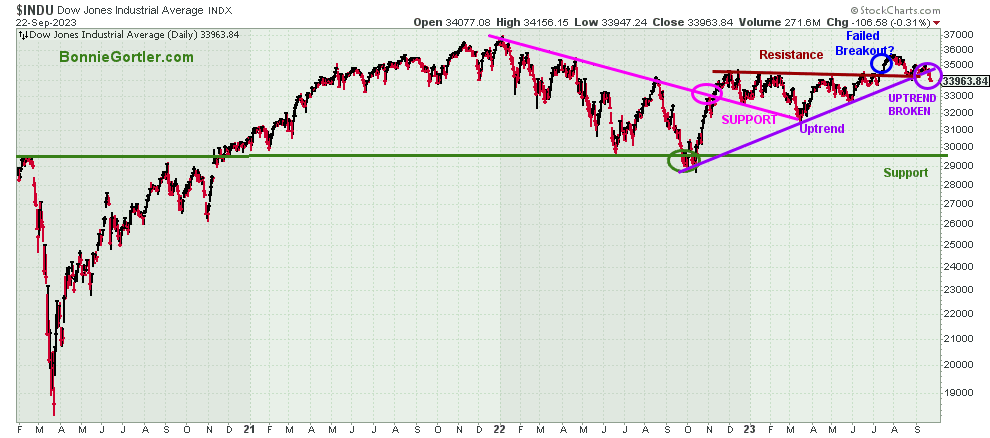
092223 Dow Jones Industrial Daily
Source: Stockcharts.com
The Dow Jones Industrial Average fell -1.89%, closing at 33936.64, breaking the October 2022 uptrend, a short-term negative.
Figure 10: Daily iShares Russell 2000 (IWM) Price (Top) and 12-26-9 MACD (Middle and Money Flow (Bottom)
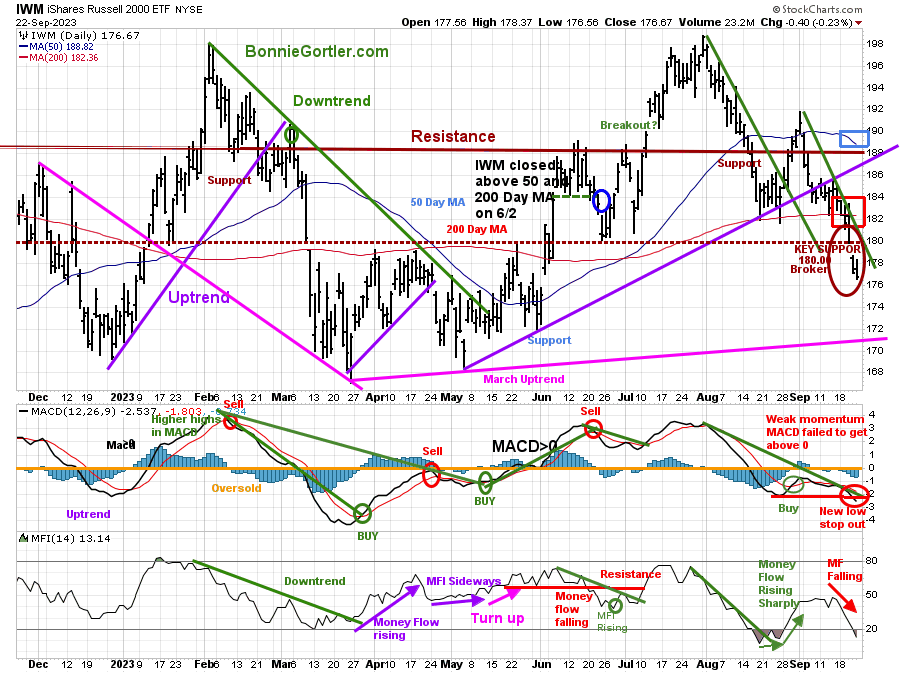
092223 IWM Daily
Source: Stockcharts.com
The top chart is the daily iShares Russell 2000 Index ETF (IWM), the benchmark for small-cap stocks, with a 50-Day Moving Average (MA) (blue line) and 200-Day Moving Average (MA) (red line) that traders watch and use to define trends.
IWM remains weak, down -3.72%, falling six days in a row, closing at 183.92 below the 200-day MA (blue rectangle) and the 50-day MA.
Support is at 174.00 and 170.00. Resistance is at 180.00, 184.00, and 188.00. MACD (middle chart) is on a sell after making a lower low, and Money Flow (lower chart) is falling. Risk is high of an accelerated decline if IWM continues to decline and closes below 170.00, but a close above 184.00 could lead to another rally attempt.
Figure 11: Daily Semiconductors (SMH) (Top) and 12-26-9 MACD (Middle and Money Flow (Bottom)
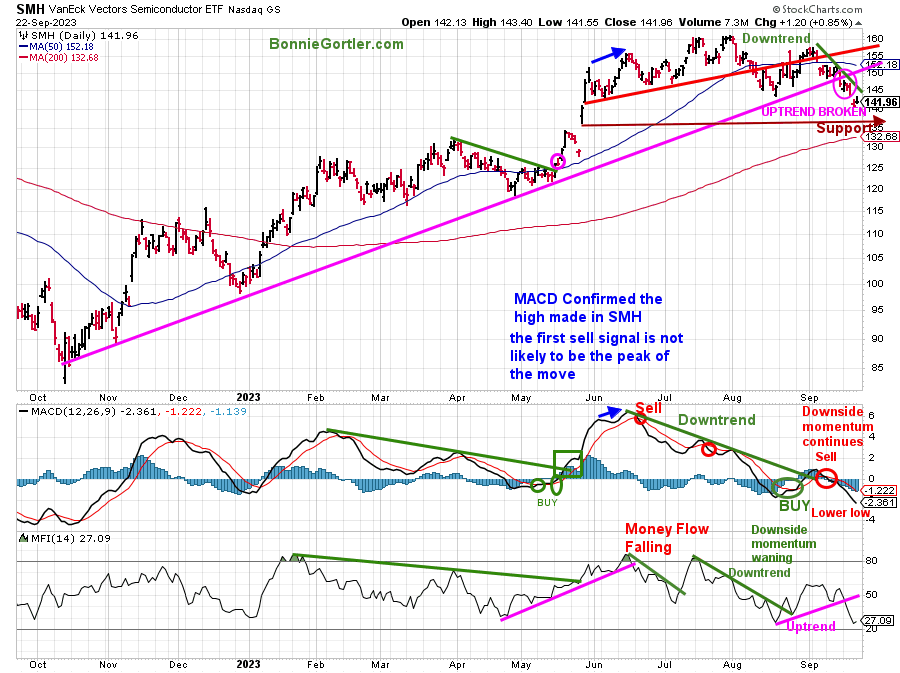
092223 SMH Daily
Source: Stockcharts.com
The top chart shows the Daily Semiconductors (SMH) ETF, concentrated mainly in US-based Mega-Cap Semiconductors companies. SMH tends to be a lead indicator for the market when investors are willing to take on increased risk and the opposite when the market is falling.
Semiconductors (SMH) fell sharply last week, down -3.30%. Support is at 140.00, 135.00 and 132.00. Resistance is at 147.00, 153.00, and 160.00.
SMH broke the 2022 October uptrend (bottom pink line), which raises the risk of a further decline toward 132.00.
MACD (middle chart) remains on a sell, a lower low made last week with downside momentum continuing.
Money Flow (lower chart) broke its uptrend from August (pink line) and is falling.
There are no signs of a bottom yet in SMH, with MACD making a new momentum low. Look for a safer buying opportunity in 3-6 weeks.
Figure 12: Daily Invesco QQQ Trust (QQQ) Price (Top) and 12-26-9 MACD (Middle) and Money Flow (Bottom)
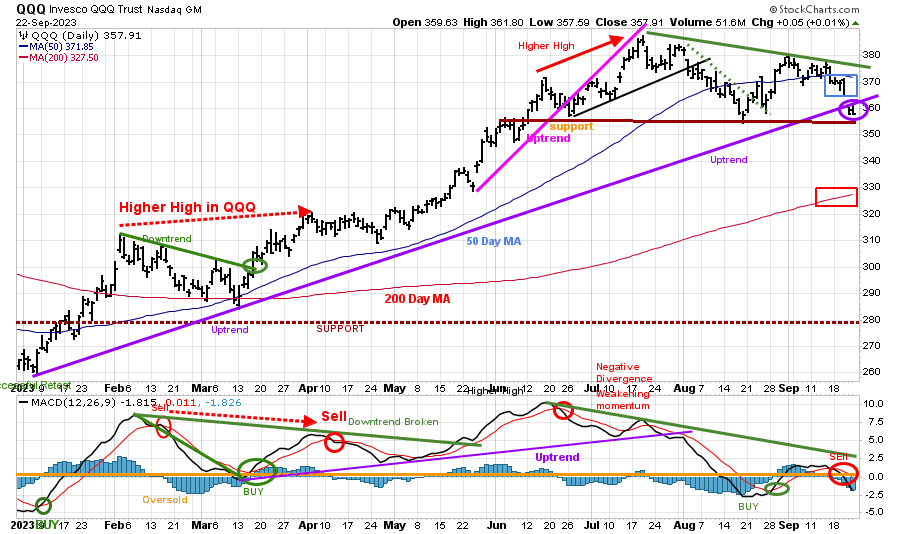
092323 QQQ Daily
Source: Stockcharts.com
The chart shows the daily Invesco QQQ, an exchange-traded fund based on the Nasdaq 100 Index. QQQ made a low in October 2022 (red circle), followed by a successful retest of the low in early January 2023 and the start of an uptrend.
QQQ broke its 2023 uptrend last week (purple circle) after a few attempts at the July high.
Last week, QQQ fell -3.34%, closing at 357.91, below the 50-day Moving Average (blue rectangle), while remaining well above the 200-day Moving Average (red rectangle), which is positive.
Support is 355.00 and 335.00, with resistance at 362.00, 372.00, and 380.00.
The bottom chart is MACD (12, 26, 9) is on a sell, failing to break the downtrend from June. However, with strength this week, MACD can generate a fresh buy, setting up a favorable double-bottom formation and potential buying opportunity.
Be cautious, waiting for confirmation that downside momentum has subsided.
Figure 13: Weekly QQQ Trust (QQQ) and 12-26-9 MACD (Bottom)
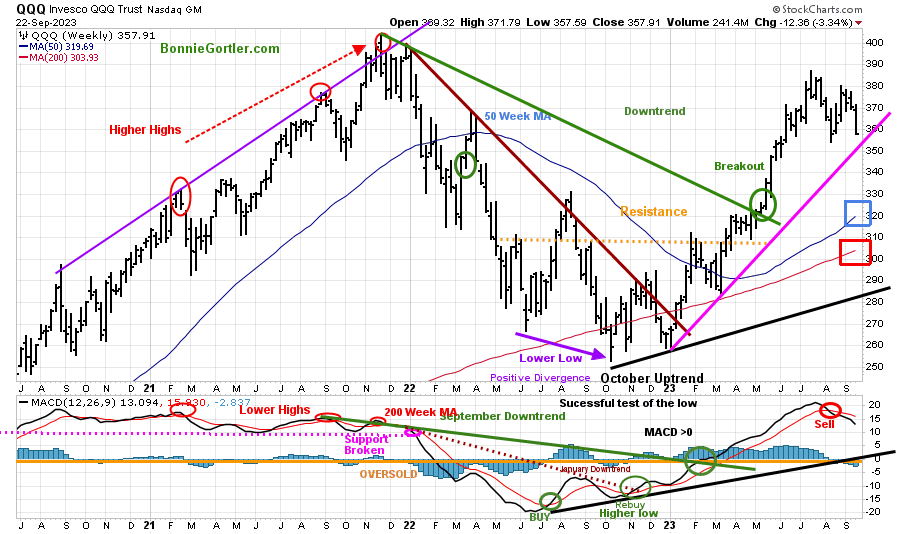
092323 QQQ Weekly
Source: Stockcharts.com
The intermediate trend remains up (pink line), with QQQ closing above the 50-week (blue rectangle) and 200-week Moving Average (red rectangle), but could shift to down if there is no rally this week.
However, MACD (lower chart) is on a sell, clearly showing momentum is weakening.
Book a 15-minute consultation with me. Learn how here.
Figure 14: The S&P 500 Index (SPY) Daily (Top) and 12-26-9 MACD (Bottom)
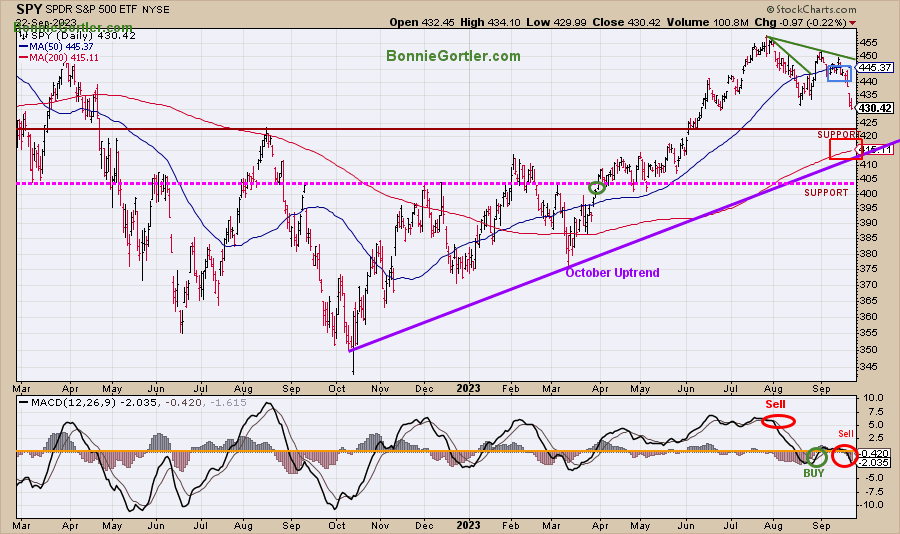
092323 SPY Daily
Source: Stockcharts.com
The S&P 500 (SPY) uptrend remains since October 2022 (purple line).
However, it was not a good week for the SPY, falling -2.92 %, closing at 430.42, closing decisively below the 50-day Moving Average (blue rectangle) but remaining above the 200-day Moving Average (red rectangle).
Resistance is 446.00 and 452.00. Support is at 425.00, 410.00, and 405.00.
MACD (bottom chart) is on a sell.
If the SPY closes below 425.00, that would be negative.
If SPY closes above 425.00 and turns up this week, MACD can generate a fresh buy, setting up a favorable double-bottom formation and potential buying opportunity.
On the other hand, further weakness would mean a potentially safer bottom is not likely for 3-6 weeks.
Figure 15: The S&P 500 Index (SPY) Weekly (Top) and 12-26-9 MACD (Bottom)
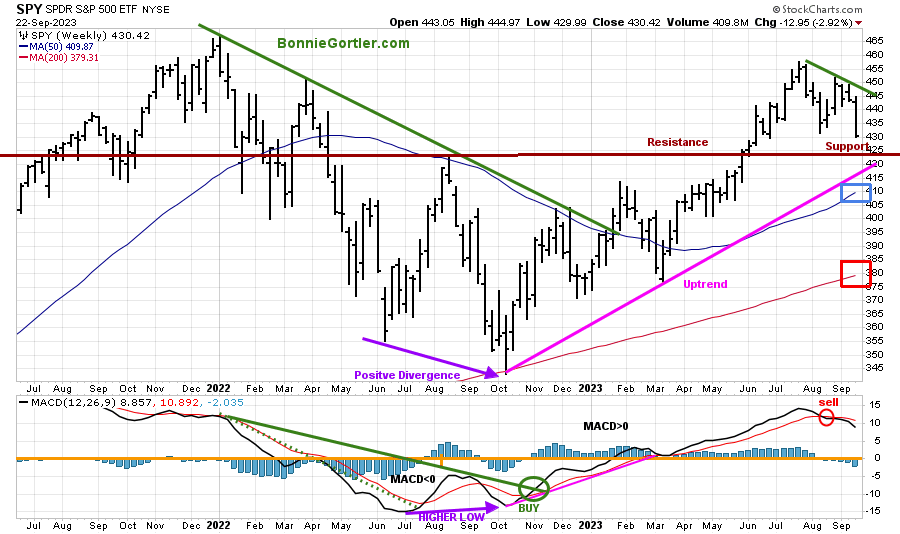
092323 SPY weekly
Source: Stockcharts.com
The intermediate trend remains up (pink line), with SPY closing above the 50-week (blue rectangle) and 200-week Moving Average (red rectangle). However, the intermediate trend could shift to down if the uptrend breaks and the decline continues.
MACD (lower chart) is on a sell, clearly showing momentum is weakening.
Summing Up:
It was an ugly week for the major averages as the September decline continued as yields rose. Hot stocks have fallen sharply as traders locked in profits as there was increased fear by investors. Risk has increased of further decline since market breadth is not improving, with more stocks making new Lows on the New York Stock Exchange and Nasdaq. The market fell more than I expected. However, the intermediate trend remains up at Friday’s close, as well as the end of the month and the potential end of the quarter window dressing. Short-term momentum oscillators are oversold, where bottoms occur and potential buying opportunities develop. Be cautious, waiting for confirmation that downside momentum has subsided, but be alert if the averages stabilize and start rising.
Remember to manage your risk, and your wealth will grow.
Let’s talk investing. You are invited to set up your Free 30-minute Wealth and Well-Being Strategy session by clicking here or emailing me at Bonnie@BonnieGortler.com. I would love to schedule a call and connect with you.
Disclaimer: Although the information is made with a sincere effort for accuracy, it is not guaranteed that the information provided is a statement of fact. Nor can we guarantee the results of following any of the recommendations made herein. Readers are encouraged to meet with their own advisors to consider the suitability of investments for their own particular situations and for determination of their own risk levels. Past performance does not guarantee any future result


Create more wealth in your life
with these simple strategies.
As an added bonus you will also
receive BG’s Updates and Ezine

Discover how to quickly create more well-being in your life with these simple strategies.
As an added bonus you will also
receive BG’s Updates and Ezine

As an added bonus you will receive BG’s Updates and Ezine

All work listed on BonnieGortler.com is licensed under a Creative Commons Attribution - Noncommercial - No Derivative Works 3.0 Unported License.


Free Report:
Grow and Sustain Your Wealth
Discover how to grow your money with these easy, simple steps.

