

10 Simple Tips for Financial Well-Being
07/01/2026
A winning week on Wall Street. Each of the eleven S&P sectors finished higher for the week ending 06/25/21. Four gained more than the SPDR S&P 500 ETF Trust (SPY), up 2.82%. Energy (XLE) and Financials (XLF) were the leading sectors, +6.71%, and +5.24%. Real Estate (XLRE) and Utilities (XLU) lagged but gained +1.47% and +0.59%.
S&P SPDR Sector ETFs Performance Summary
Week Ending 6/25/21
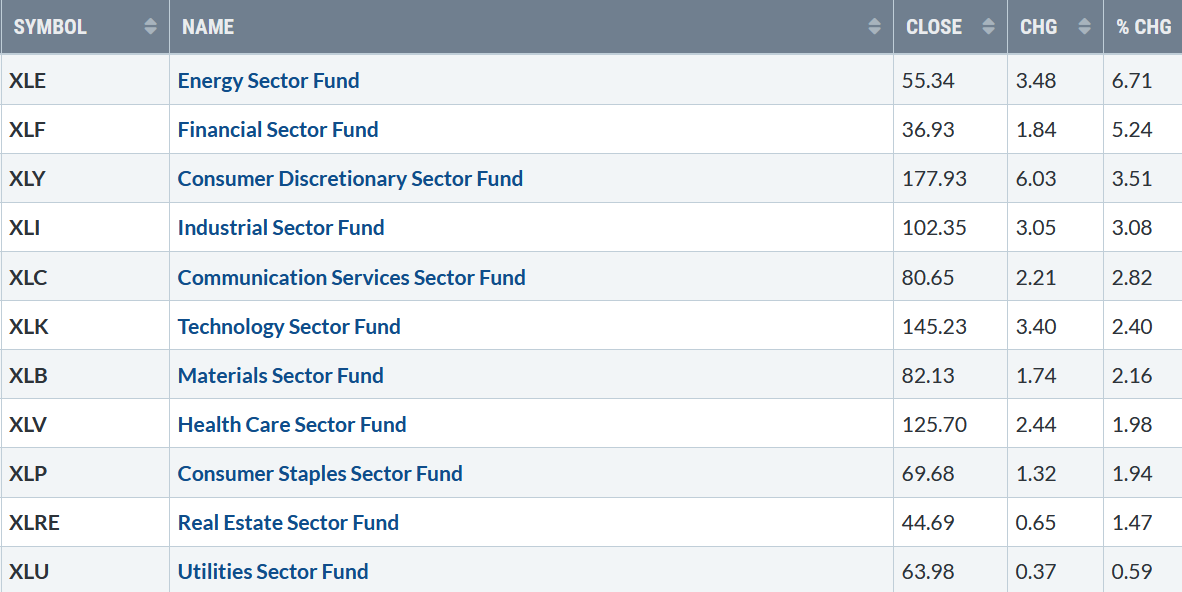
Source: Stockcharts.com
10-Year Treasury yields rose to 1.536%, fueling the financial sector, which had been down two weeks in a row. Rates rising now are likely to slow the gains of growth stocks in the future. On the other hand, a decline will likely attract more buying into growth stocks and profit-taking in value stocks, especially financials. Yields could fall to 1.27%, its lower channel objective (Figure 1 in green) over the next several weeks to months if they stay below 1.57%
Figure 1: 10-Year Treasury Yields
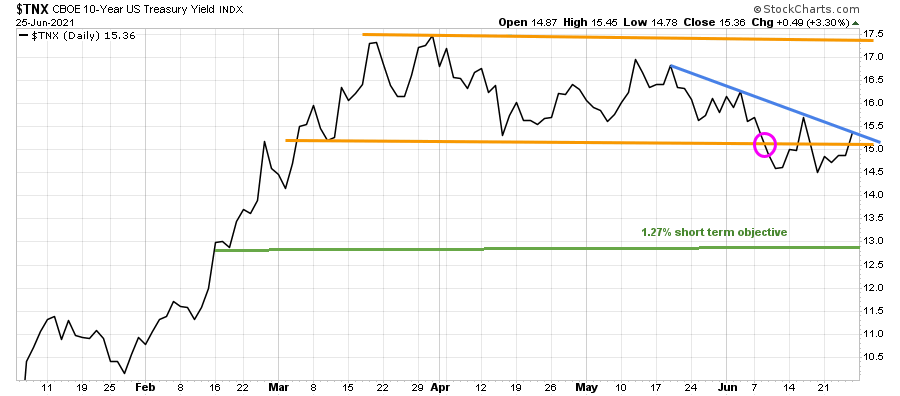
Source: Stockcharts.com
The S&P 500 ended the week at a record high on Friday, its best week since early February and the Nasdaq’s strongest since April. The Dow had its best week since March. The Dow gained +3.4%, &P 500 up +2.7%, and Nasdaq gained +2.4%, closing slightly below a record high made on Thursday. The Russell 2000 index was the star performer was up +4.32%.
Weekly market breadth was positive, with more stocks up than down for both the Nasdaq and New York Stock Index (NYSE). The New York Stock Exchange Index had 2583 advances and 899 declines. Nasdaq had 3140 advances and 1408 declines.
Figure 2: Daily New York Stock Exchange (NYSE) New Lows
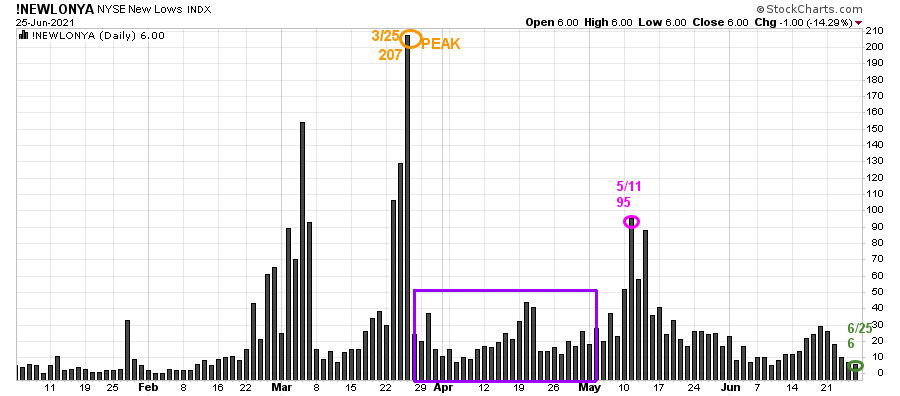
Source: Stockcharts.com
On 3/25, the NYSE New Lows peaked at 207 (orange circle) and immediately contracted (purple rectangle). On 5/11, New lows on NYSE jumped to 95, their highest level since late March flashing a warning sign, but New Lows immediately dropped.
With last week’s rally, New Lows contracted to 6 (green circle), now in the lowest-risk zone where stock prices tend to rise.
Watching New lows on the New York Stock exchange is a simple technical tool that helps awareness about the immediate trend’s direction. In my book, Journey to Wealth, when the New Lows are below 25, the market is very strong (Very Low Risk and prices tend to rise). When New Lows are between 25 and 50, risk is low, and the odds of a further rally are likely.
If New Lows begin to expand and have a succession of days over 95 (the 5/11 high), this will imply more risk and a shift in trend. On the other hand, if they remain low, the odds favor the resumption of the rally.
“Losing potential profits hurts the ego; losing money really hurts.”-Gerald Appel
ETFs to Monitor
Figure 3: Performance week of 6/18 – 06/25/21
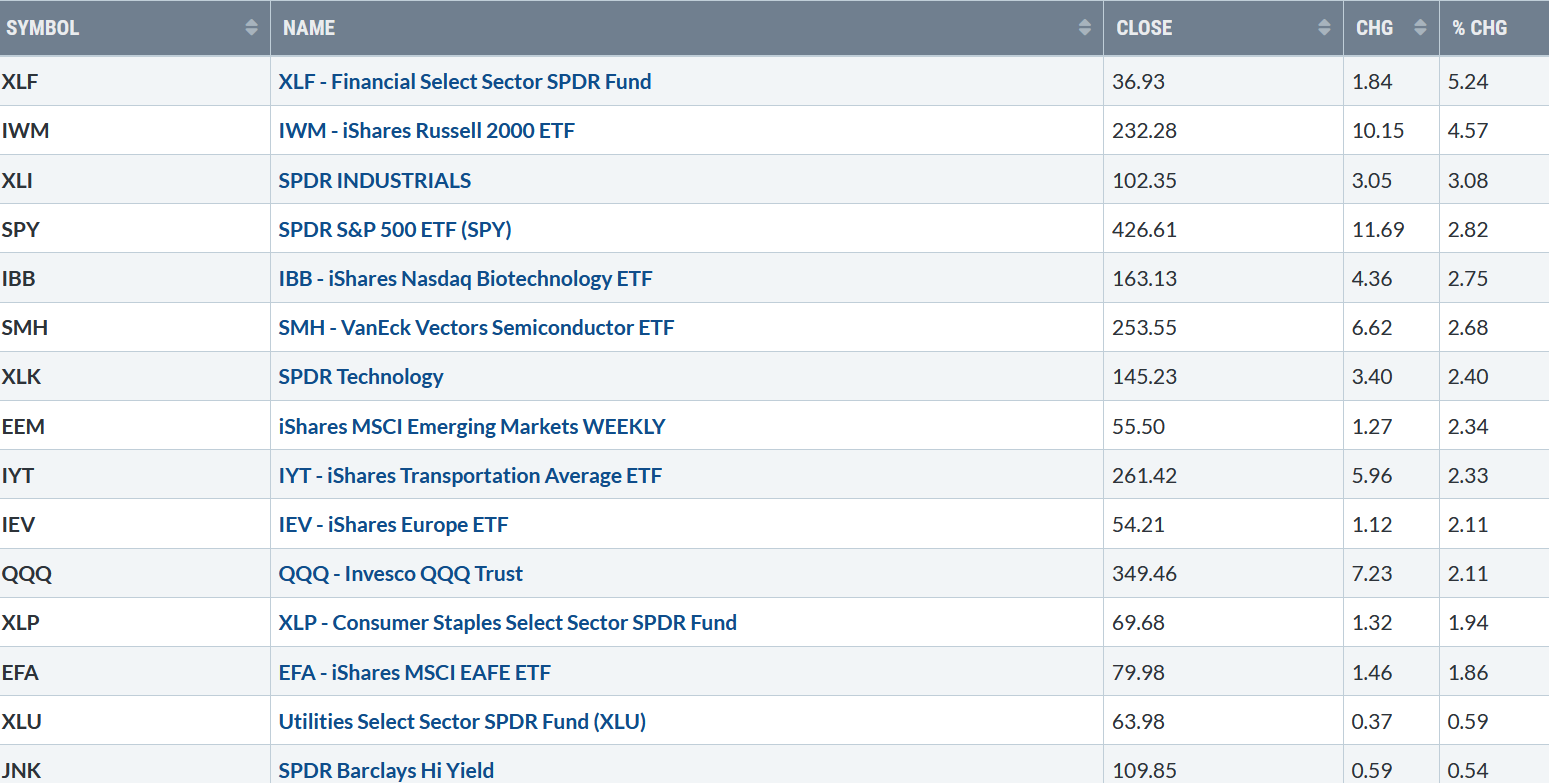
Source: Stockcharts.com
Positives
Negatives
Figure 4: LORD Abbett High Yield Fund
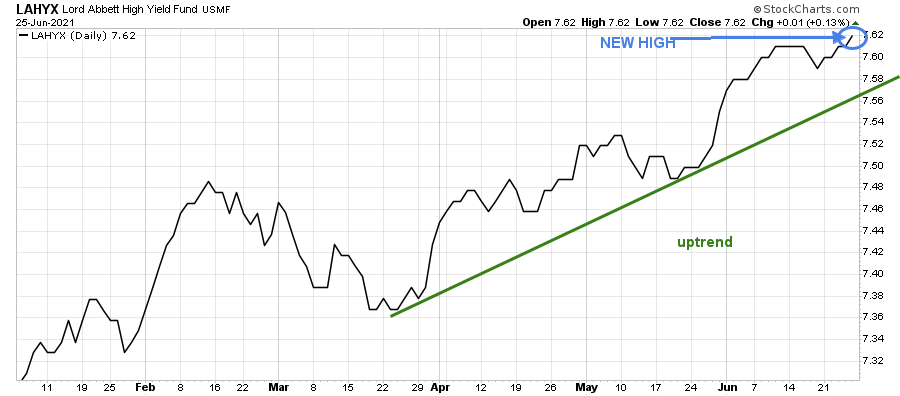
Source: Stockcharts.com
Figure 5: CNN Fear and Greed Index
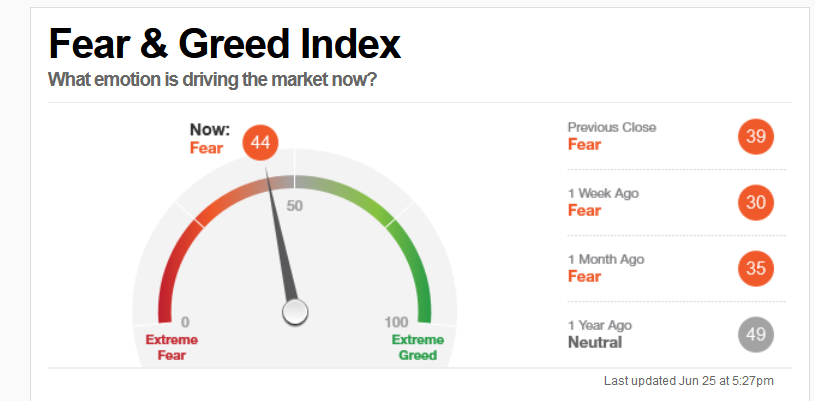
Source: CNN Business
Figure 6: Nasdaq New Highs
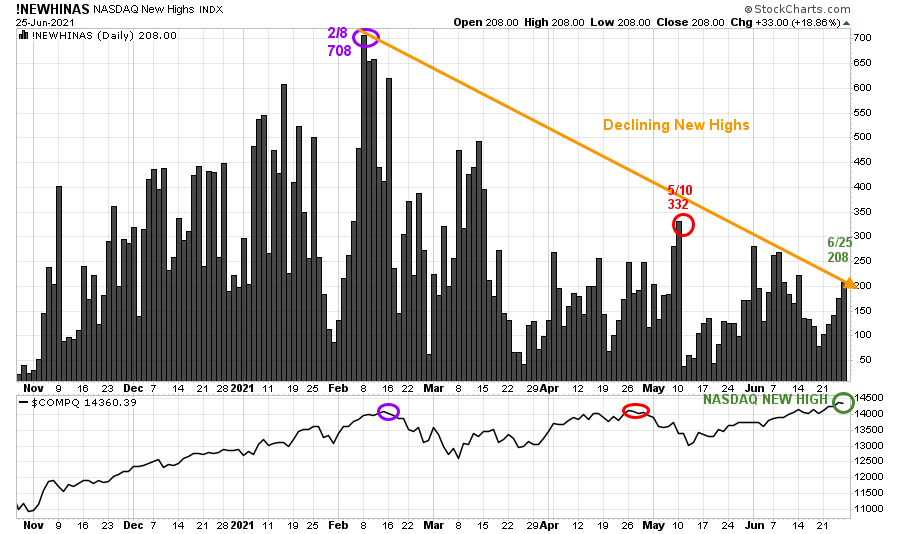
Source: Stockcharts.com
Despite the New High in the Nasdaq, New Highs closed at 208, well below the peak reading of 708 set on 2/8. Watch if New Highs begins to increase or decline over the next few weeks. If Nasdaq New Highs rise sharply, this will be a clue Nasdaq can sustain its gains over the next several weeks. On the other hand, if they falter, that would imply the Nasdaq rally is likely to stall.
Figure 7: Ishares Transportation Average (IYT)
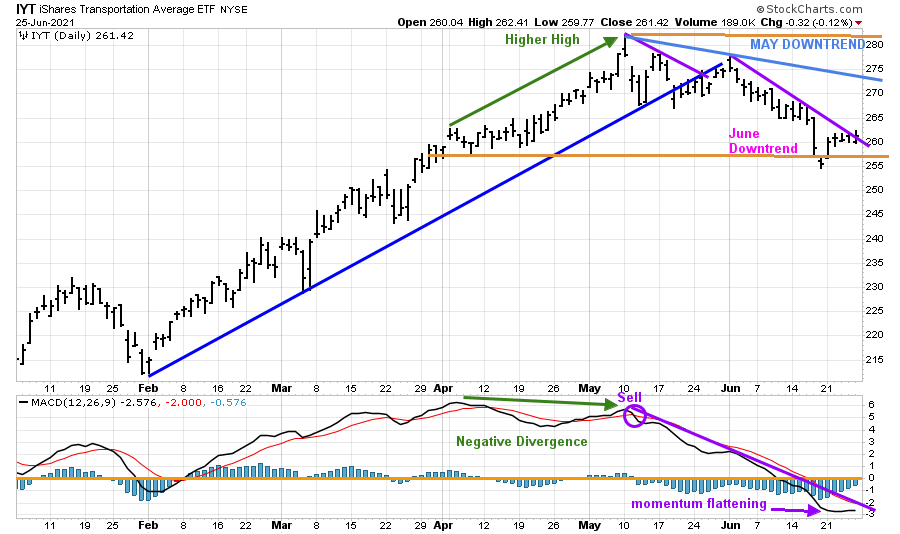
The top chart is the Transportation Average (IYT) which peaked in May. IYT downtrend from May remains in effect. However, it’s a positive sign IYT stopped declining, gaining 2.33%, closing at 261.42, slightly above the June downtrend (purple line).
It would be bullish if IYT could begin to outperform the S&P 500 and close above 265.00 and then over 275.00, breaking the May downtrend.
On the other hand, a close below 255.46 would be bearish and imply weakness that could accelerate and ultimately lead the broad market lower.
MACD (lower chart) is on a sell. However, it’s a positive sign MACD is showing downside momentum has slowed. If IYT rises this week, MACD is likely to turn up and generate a new buy signal and break the MACD May downtrend, which would be bullish for the near term.
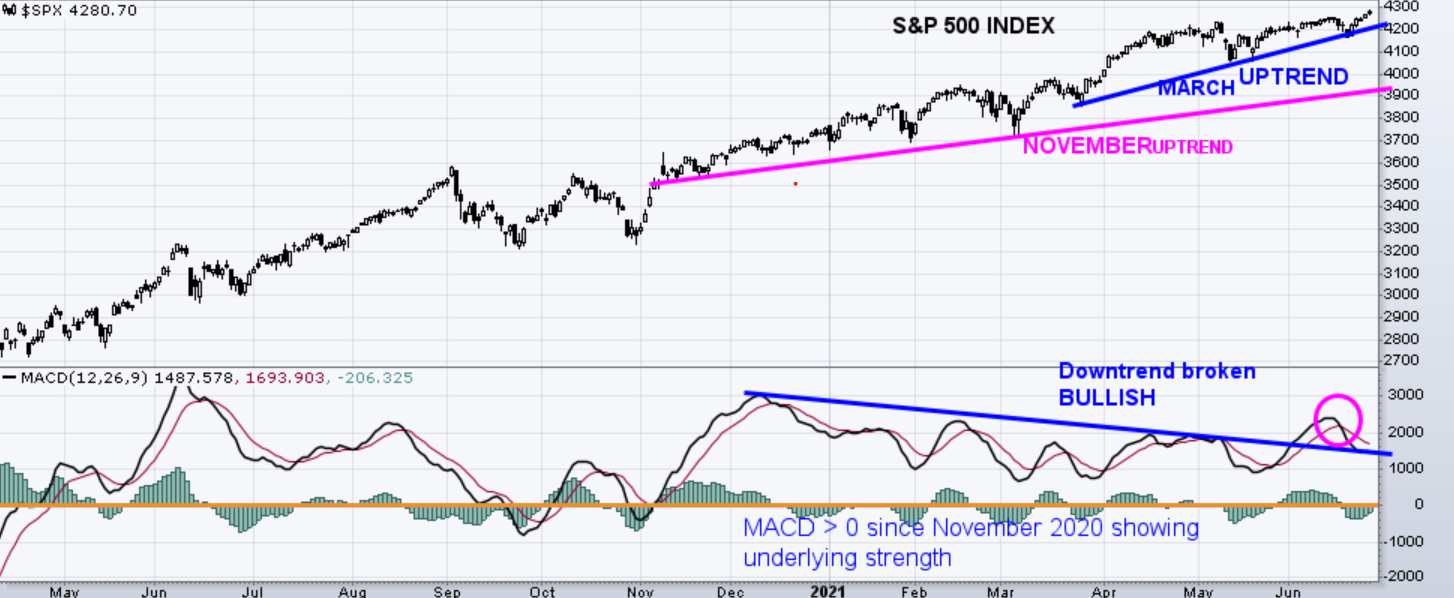
Figure 8: S&P 500 Index (Top) and MACD 12,26,9 (Bottom)
 Source: Stockcharts.com
The top chart is the S&P 500 Index in an uptrend (blue line) from March (blue line), closing at 4280.70. A close below 4155.00 would break the uptrend and warn of further weakness and potentially a decline of greater magnitude.
The lower chart is MACD, a measure of momentum. It’s a positive sign MACD December downtrend from 2020 is now broken. A powerful combination with MACD remaining above 0 since November 2020 showing underlying strength.
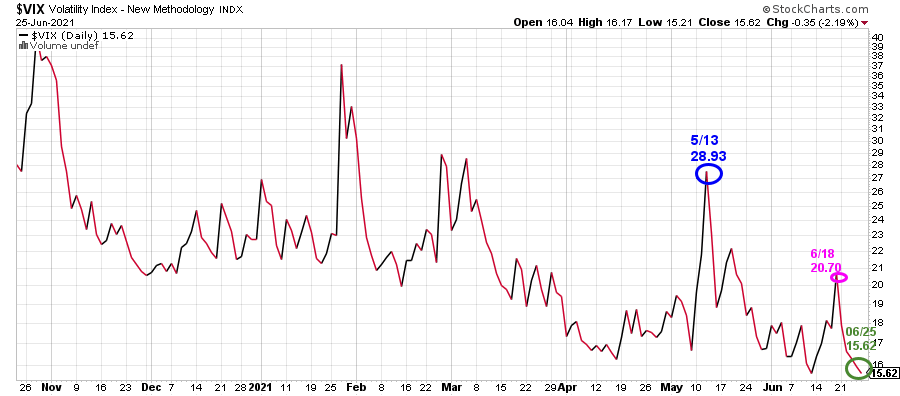
Figure 9: CBOE Volatility Index (VIX)
Source: Stockcharts.com
Fear faded among investors, and volatility fell sharply last week, closing at 15.62, its lowest level since 2/20/20 and well below its long-term average under 20.00.
A close above the 6/18 close of 22.18 would imply an increase in day-to-day fluctuations and a warning a correction could begin.
ETFs to Monitor 6/28 – 7/2
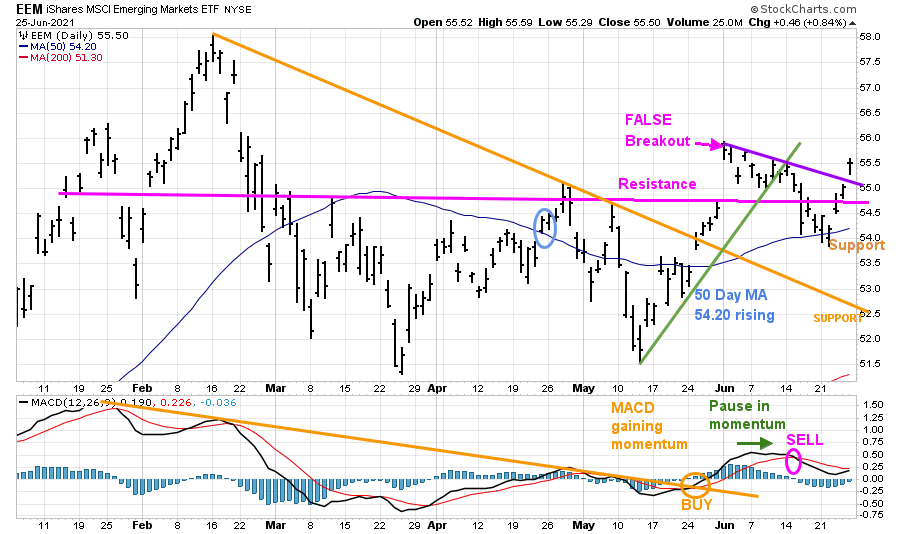
Figure 10: iShares MSCI Emerging Markets (EEM)
Source: Stockcharts.com
EEM broke above resistance, on 6/1 a false breakout, and then reversed, breaking the uptrend from May (green line) but held above its 50-Day MA. EEM then rose, breaking the June downtrend last week, up 2.3%, closing at 55.50 above 54.50 resistance and remaining above its 50-Day MA at 54.20. EEM appears ready to rise towards the upper objective of 58.50
Support is at 54.20, followed by 52.50. Resistance is 56.00unless EEM closes below 54.20. Further strength in EEM is likely to carry over into other global markets and fuel the U.S. market.
The lower chart is MACD, a measure of momentum. MACD remains on a sell. Unfortunately, it missed getting oversold, below 0 to be in a position to generate a new buy. Watch to see if MACD accelerates or if momentum pauses as it did in early June to know if EEM will rise and test its February highs.
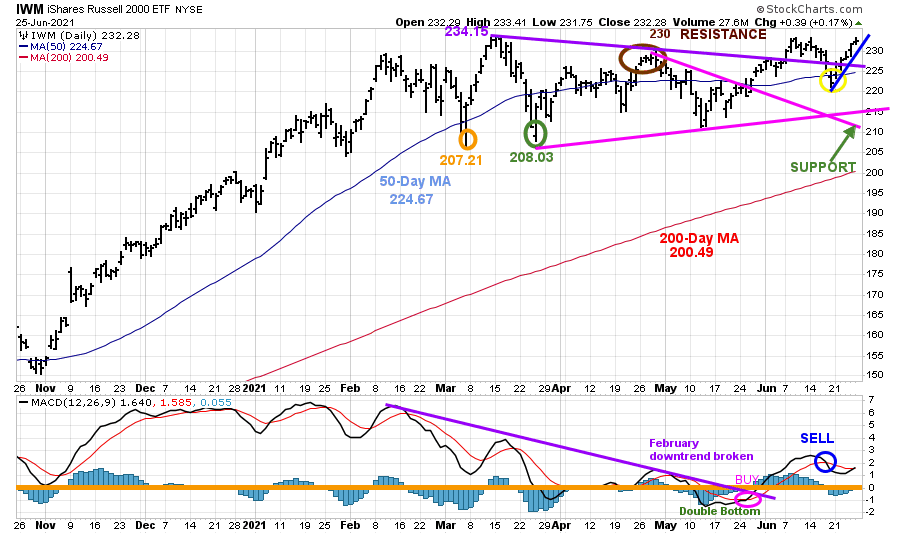
Figure 11: Daily iShares Russell 2000 (IWM) Price (Top) and 12-26-9 MACD (Bottom)
 Source: Stockcharts.com
The top portion of the chart is the daily iShares Russell 2000 Index ETF (IWM), the benchmark for small-cap stocks, with a 50-Day Moving Average (MA) (blue line) and 200-Day Moving Average (MA), that traders watch and use to define trends.
IWM made a low on 3/5 at 207.21 (orange circle), then peaked at 234.15. On 3/25, IWM successfully tested its low at 208.03 (green circle) and then stalled at 230.00, key resistance (brown circle).
IWM gained back all its previous week’s losses and more, closing at 232.28, up 4.6%. Its positive IWM closed above resistance at 230.00 and above its short-term downtrend from April (purple line).
Support is 230.00 followed by 225.00. If IWM closes below 225.00, the next area of support is between 210.00 and 215.00.
A close below the March low at 207.21 would imply an increased risk of a more serious decline.
The bottom half of the chart is MACD (12, 26, 9), a measure of momentum. MACD is on a sell and did not go below 0 for a safe reentry. A turndown in MACD would imply the recent rise in IWM is likely to fail and test the support area between 210.00 and 215.00.
Figure 12: Weekly iShares Russell 2000/S&P 500 (IWM/SPY) Relative Strength Ratio
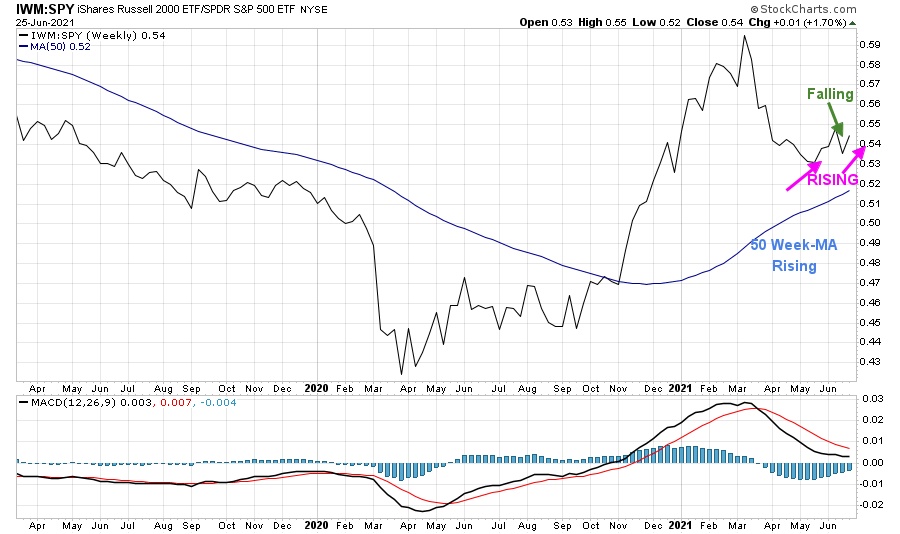
Source: Stockcharts.com
The weekly IWM /SPY ratio is flipping back and forth, now rising. It’s positive the 50-Week Moving Average (MA) continues to rise. If IWM can remain stronger than the S&P 500 (SPY), then IWM could potentially outperform the S&P 500 in the coming weeks to months.
Figure 13: Daily Invesco QQQ Trust Nasdaq (QQQ) Price (Top) and 12-26-9 MACD bottom)
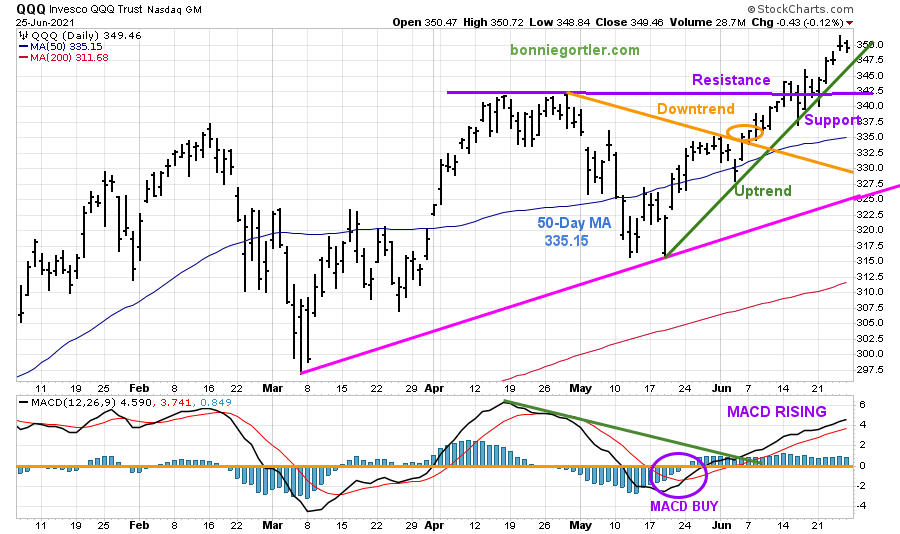
Source: Stockcharts.com
The top part of the chart shows the daily Invesco QQQ, an exchange-traded fund based on the Nasdaq 100 Index with its 50-Day Moving Average and 200-Day Moving Average. QQQ broke its May downtrend (orange circle) on 6/4 and remained in an uptrend.
QQQ gained 2.11% last week but was weaker than the S&P 500. The upside objective remains 370.00. Support is at 335.00 followed by 331.00. A close below 331.00 would negate the short-term bullish upside objective.
A close below 322.50 would break the uptrend from March and increase the odds the decline will accelerate and test the March lows.
The bottom chart is MACD (12, 26, 9), a measure of momentum. MACD remains on a buy. However, MACD is no longer rising, which bears watching if it turns down and generates a sell.
Figure 14: Daily Vaneck Vectors Semiconductor (SMH) Price (Top) and 12-26-9 MACD (Bottom)
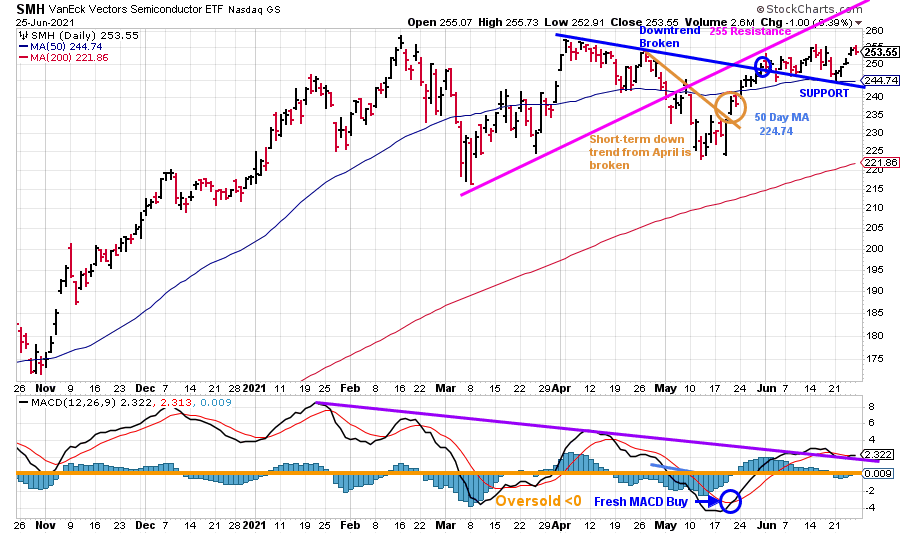
Source: Stockcharts.com
The top chart shows Semiconductors (SMH). Semiconductors (SMH) SMH closed on 6/25 at 253.55, up +2.7% last week, rising more than QQQ, a favorable sign. It remains positive that SMH closed above support at 244.00 and is above its April downtrend (blue line). A close above 255.00 will give an upside objective to 276.00.
Support is at 240.00. Resistance is at 255.00. A close below 240.00 would be a warning sign of potential weakness in the near term.
The lower chart is MACD, a measure of momentum. MACD is on a buy. However, any turn down in SMH will give a sell. Watch for MACD to see if it can hold above the downtrend from January (purple line), and turn up now, which would bode well for the broad market or if it falls below and SMH weakens.
Figure 15: ARKK Innovation ETF (ARK)
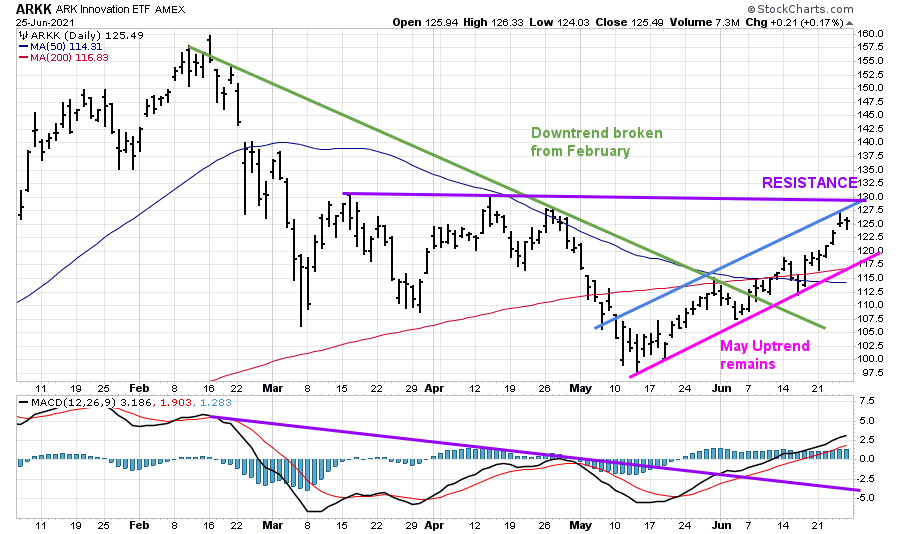
Source: Stockcharts.com
I like to watch the movement of ARKK Innovation to see the risk appetite of traders. ARKK was in a downtrend but shifted in May to an uptrend. ARKK appears to have bottomed, and with last week’s rise, ARKK is now near resistance just above 130.00. Two closes above 130.00 would imply further gains are likely.
Summing Up:
Last week was a broad market rally fueled by energy, financial, and growth stocks leading the way. Market breadth was solid. Earnings season is only a few weeks away, which is likely to increase volatility, and July and August, ordinarily volatile months. The trend is favorable. However, it’s important to see if the rally stalls now and cannot get through overhead resistance above or if the rally begins to accelerate with more stocks making new highs. I recommend continuing to give the benefit of the doubt to the bulls for now. The key closing numbers to watch for a major trend change are below 207.21 for IWM and below 322.50 for QQQ.
Remember to manage your risk, and your wealth will grow.
If you liked this article, you would love my Free report, Grow and Sustain Your Wealth. Please get it here.

I would love to hear from you. If you have any questions or comments or would like to talk about the market, click here.
Remember to manage your risk, and your wealth will grow.
Disclaimer: Although the information is made with a sincere effort for accuracy, it is not guaranteed that the information provided is a statement of fact. Nor can we guarantee the results of following any of the recommendations made herein. Readers are encouraged to meet with their own advisors to consider the suitability of investments for their own particular situations and for determination of their own risk levels. Past performance does not guarantee any future results.


Create more wealth in your life
with these simple strategies.
As an added bonus you will also
receive BG’s Updates and Ezine

Discover how to quickly create more well-being in your life with these simple strategies.
As an added bonus you will also
receive BG’s Updates and Ezine

As an added bonus you will receive BG’s Updates and Ezine

All work listed on BonnieGortler.com is licensed under a Creative Commons Attribution - Noncommercial - No Derivative Works 3.0 Unported License.


Free Report:
Grow and Sustain Your Wealth
Discover how to grow your money with these easy, simple steps.

