


10 Simple Tips for Financial Well-Being
07/01/2026
Rising prices continue. Ten of the eleven S&P SPDR sectors finished higher for the week. Technology (XLK) and Materials (XLB) were the best sectors, while Energy (XLE) lagged the weakest, with the SPDR S&P 500 ETF Trust (SPY) up +2.60%.
S&P SPDR Sector ETFs Performance Summary 6/09/23-6/16/23
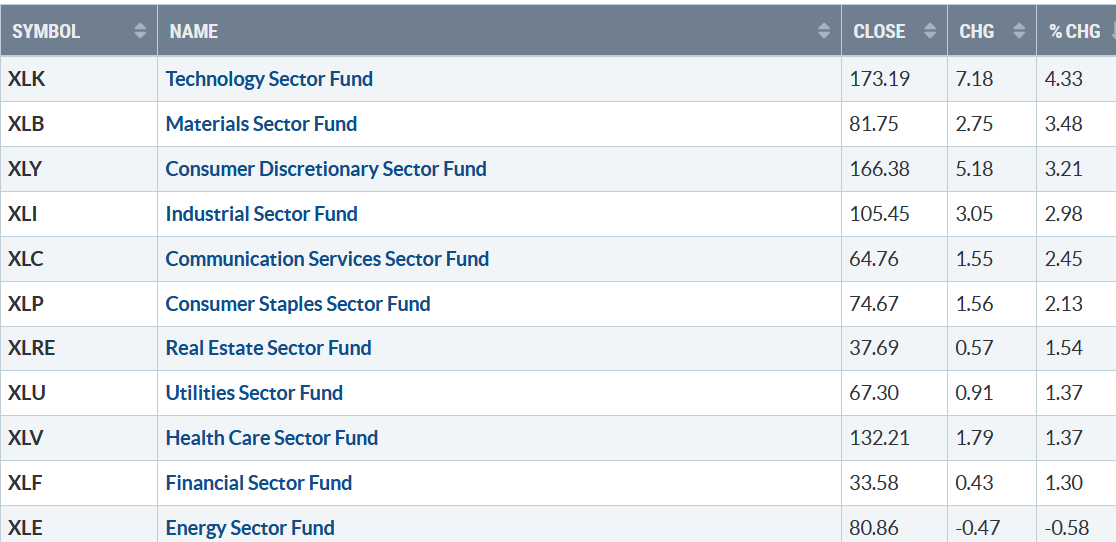
061623 SPDR Sectors
Source: Stockcharts.com
Figure 2: Bonnie’s ETFs Watch List Performance Summary 6/09/23-6/16/23
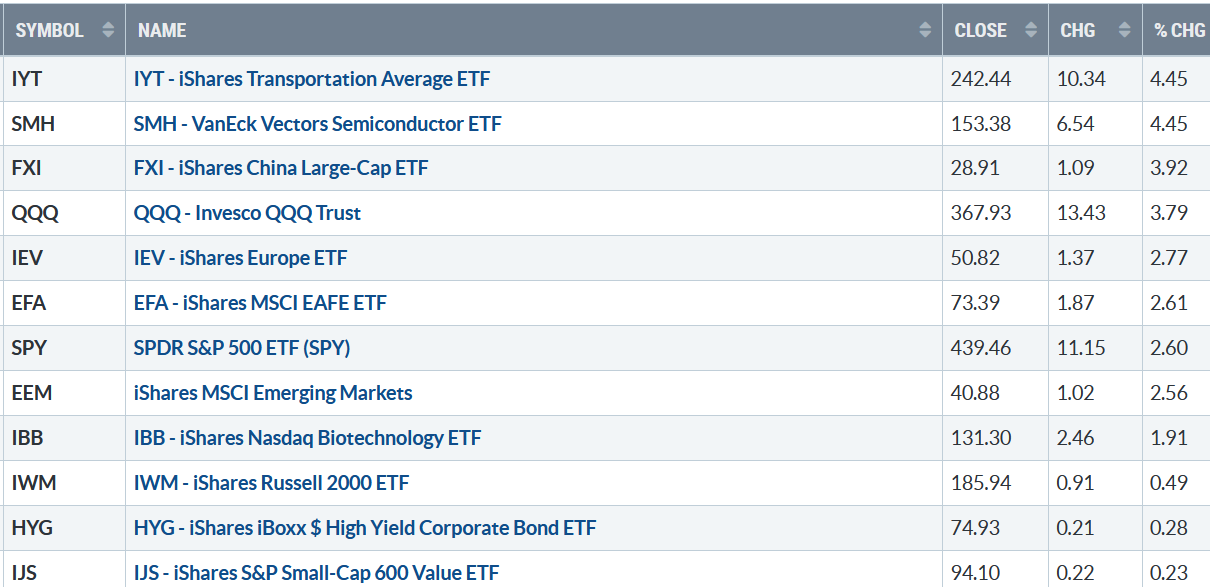
061623 Week ETFs
Source: Stockcharts.com
Transports, Semiconductors, China, and Technology led the rally last week, while Small Cap Value and Growth had small gains after showing solid strength in the previous two weeks.
Figure 3: iShares Transportation Average (IYT) Price (Top) and 12-26-9 MACD (Bottom
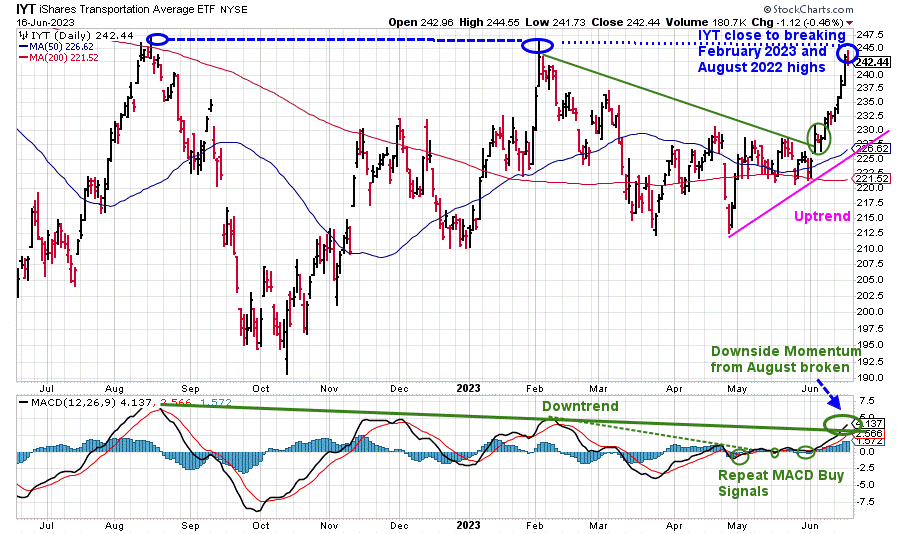
061623 IYT Daily
Source: Stockcharts.com
The Transportation Average (IYT) broke out in early June (green circle) after consolidating near the 50-Day and 200-Day Moving Average gaining strength and close to breaking the August 2022 and February 2023 highs. When IYT is a market leader, it tends to be positive for the overall market.
MACD (bottom chart) remains on a buy after several repeat signals with penetration of downside momentum from positive last August. It would be positive if the Dow Jones Industrials and Transports make a new high this week, confirming one another.
Figure 4: Fear & Greed Index
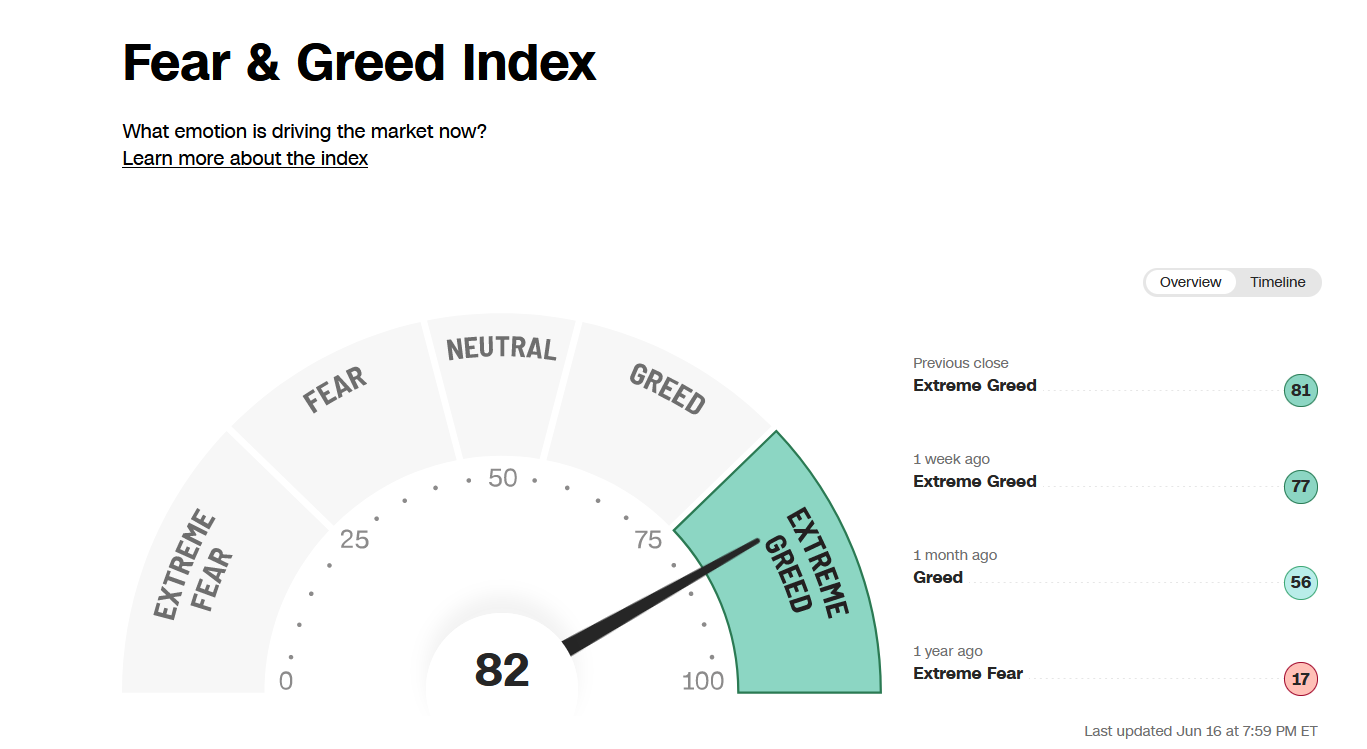
061623 Fear and Greed Index
Source: CNN
Investor sentiment based on the Fear and Greed Index (a contrarian index) measures the market’s mood, rose again last week, closing at 82, showing extreme greed. It’s not a reason to expect an immediate sell-off because, in the past, strong markets can stay in extreme greed conditions, sometimes 4-6 weeks before a decline begins.
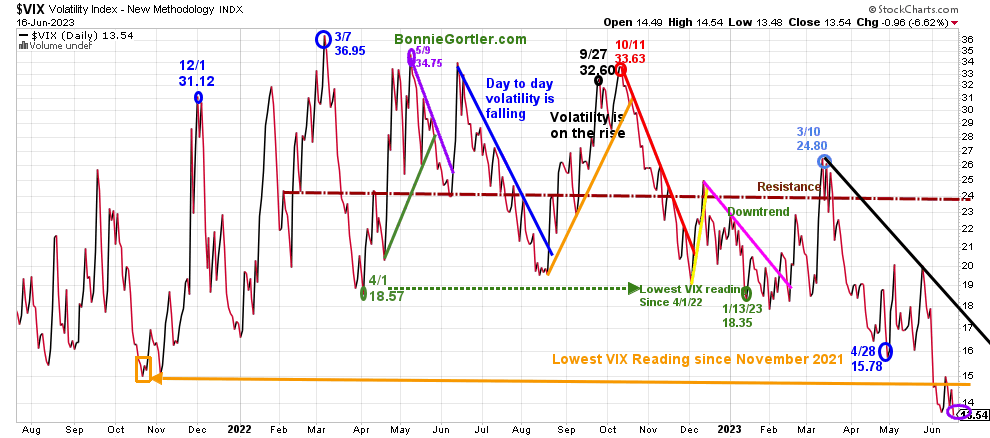
Figure 5: CBOE Volatility Index VIX
061623 VIX Daily
Source: Stockcharts.com
The CBOE Volatility Index (VIX), a measure of fear, traded above 20.00 for most of 2022, with a high at 36.95 on 3/7 (blue circle). A new VIX low did not occur until 1/13/23 at 18.35 (green circle).
Volatility Index (VIX) has been trending down since March 2023. Despite some volatility with the Fed meeting and economic news released last week, VIX fell, closing at 13.54 (purple circle), its lowest since January 2020. Intraday volatility will likely remain low over the next several weeks. However, if VIX closes above 20.00, look for volatility to increase towards 24.00 and potentially higher.
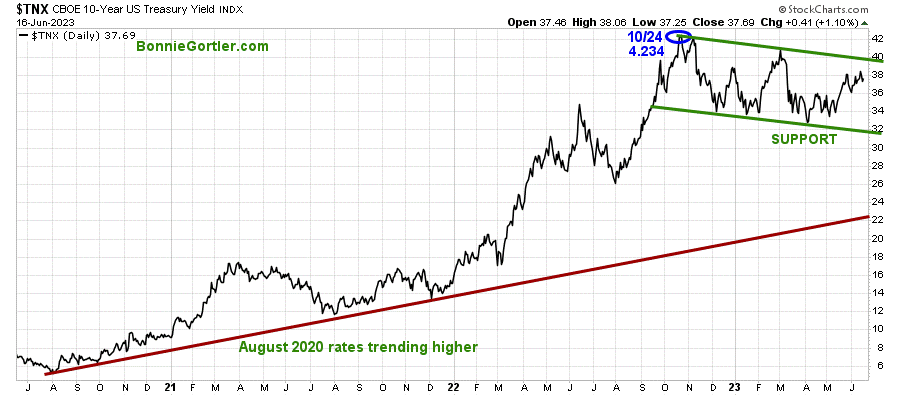
Figure 6: UST 10YR Bond Yields Daily
061623 UST 10 Yr Bond Yields Daily
Source: Stockcharts.com
The 10-Year U.S. Treasury yields fell last week, closing at 3.725%. Support remains at 3.20%, with resistance at 4.00%. Yields rising above 4.00% could quickly put pressure on equities.
The major market averages were all higher last week. The Dow rose +1.25%, the S&P 500 up +2.58%, a five-week winning streak, and the Nasdaq gained +3.25%, its 8th straight positive week. The Russell 2000 Index rose +0.52%, underperforming after outperforming the major averages the past two weeks.
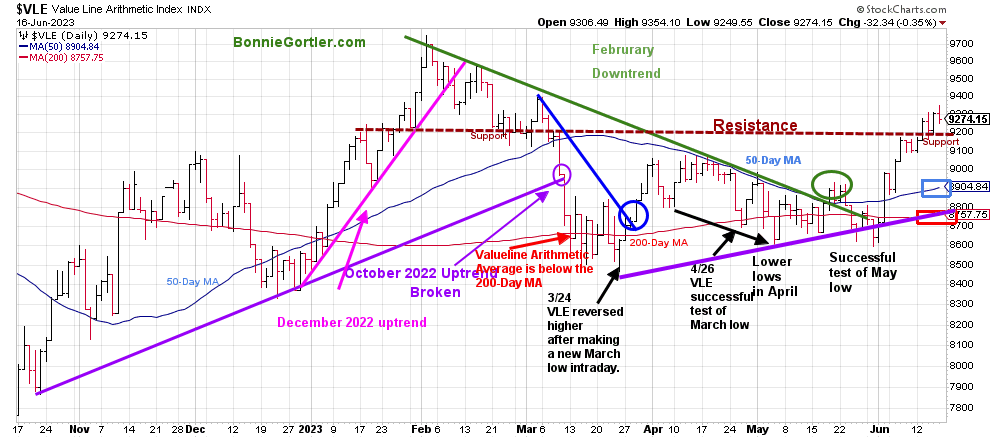
Figure 7: Value Line Arithmetic Average
061623 VLE Daily
Source: Stockcharts.com
The Value Line Arithmetic Index ($VLE) is a mix of approximately 1700 stocks. VLE broke the October 2022 uptrend in early March, headed lower, and on 3/24, bottomed and reversed higher. In April and May, there were successful tests of the low.
VLE gained +1.90%, closing above key resistance at 9200 for the first time since March. VLE remains above the 50-Day MA (blue rectangle) and the 200-Day MA implying underlying strength.
Support is at 9200, 9050, and 8900. After closing above 9200, VLE implies the move to continue higher toward 9400 and potentially 9700.
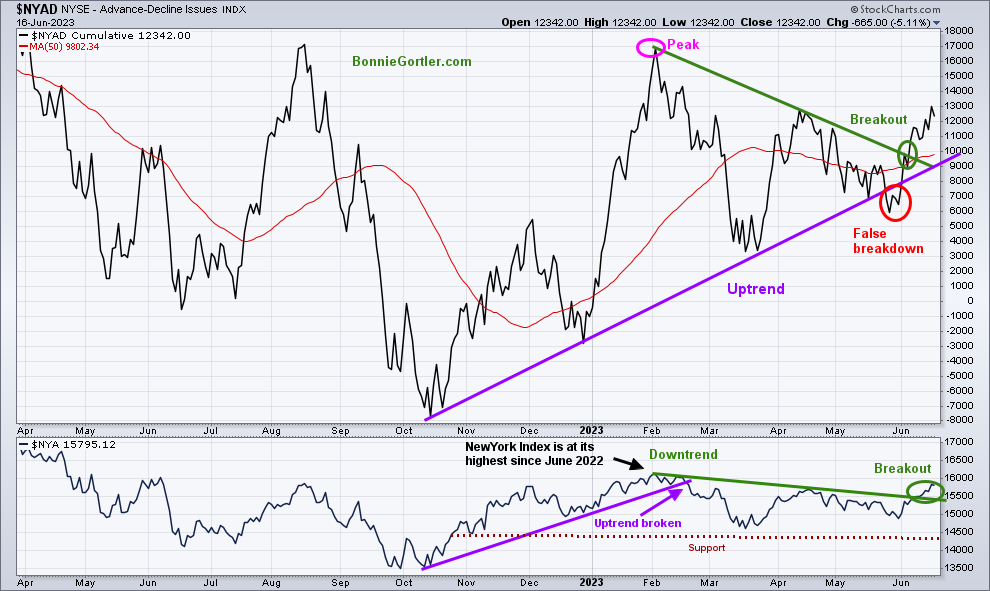
NYSE Confirms AD-Line breakout.
Weekly market breadth was positive on the New York Stock Exchange Index (NYSE) and for the Nasdaq. The NYSE had 1813 advances and 1303 declines, with 276 new highs and 56 new lows. There were 2969 advances and 1959 declines on the Nasdaq, with 467 new highs and 249 new lows.
Continued expansion in the weekly number of New Highs on the Nasdaq and NYSE with the number of weekly New Lows contracting would be favorable.
Figure 8: NYSE Cumulative Advance-Decline Line and New York Stock Exchange Index (Below)
061623 Daily NYSE Cumulative Advance-Decline Line and NYSE
Source: Stockcharts.com
The top chart is the Cumulative Advance-Decline Line (AD Line) of the NYSE, a breadth indicator based on the number of advancing stocks minus the number of declining stocks. The NYSE AD Line peaked in February 2023 (green circle top chart) and then declined as the S&P 500 and Nasdaq rose.
The uptrend in the NYSE Advance-Decline Line from October (top chart) had a false breakdown (red circle) in May (red circle).
Breadth has improved in June, breaking the AD-Line’s downtrend from February (green line). However, it remains below the February highs (pink circle).
It’s bullish the New York Index (lower chart) has confirmed the AD line breakout of the downtrend (green line).
Let’s talk investing. You are invited to set up your Free 30-minute Wealth and Well-Being Strategy session by clicking here or emailing me at Bonnie@BonnieGortler.com. I would love to schedule a call and connect with you.
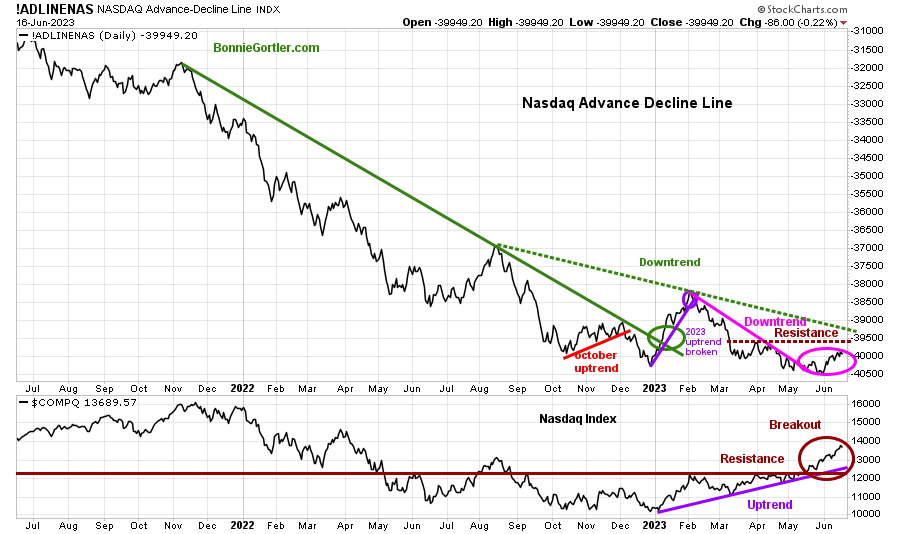
Nasdaq breadth remains below resistance.
Figure 9: Nasdaq Advance Decline Line Daily (Top) and Nasdaq (Bottom)
061623 Daily Nasdaq Cumulative Advance-Decline Line
Source: Stockcharts.com
The chart is the Nasdaq Daily Advance-Decline Line, a technical indicator that plots the difference between the number of advancing and declining stocks.
In January, the October 2022 downtrend was broken (solid green line). However, the improvement in the market breadth was short-lived, with the Nasdaq Advance-Decline line deteriorating in February 2023.
The August downtrend (green dotted line top chart) remains in effect as Nasdaq continues to new 52-week highs (lower chart). It will be favorable if the AD-Line gets through resistance (brown dotted line and then breaks the August downtrend (green dotted line) to confirm more stocks will participate in the advance.
Learn more about charting in my Free 33-minute Training, Charting Strategies to Cut Risk and Trade with the Trend. Sign up here
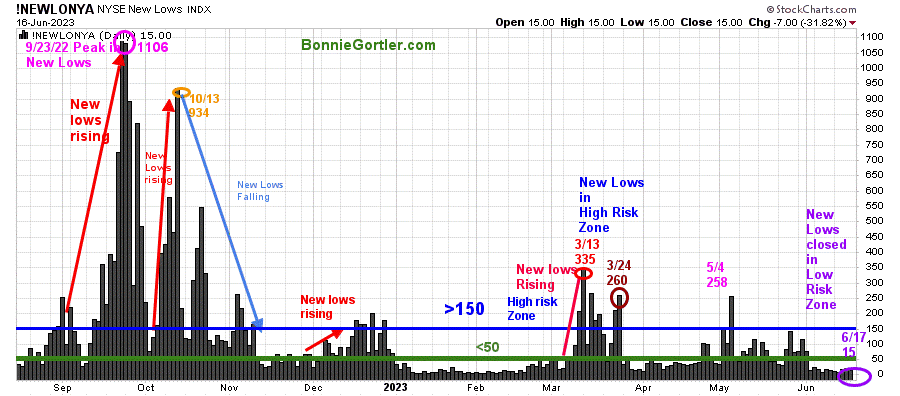
Figure 10: Daily New York Stock Exchange (NYSE) New Lows
061623 NYSE New Lows Daily
Source: Stockcharts.com
Watching New Lows on the New York Stock Exchange is a simple technical tool that helps awareness of the immediate trend’s direction. New lows warned of a potential sharp pullback, high volatility, and “panic selling” for most of 2022, closing above 150. The peak reading was 9/23/22 when New Lows made a new high of 1106 (pink circle), and New Lows expanded to their highest level in 2023 on 3/13/23 (red circle) to 335.
It’s positive New Lows closed at 15 (purple circle), remaining in the lowest-risk zone below 25, for the third straight week.
Learn more about the significance of New Lows in my book, Journey to Wealth, published on Amazon. If you would like a preview, get a free chapter here.
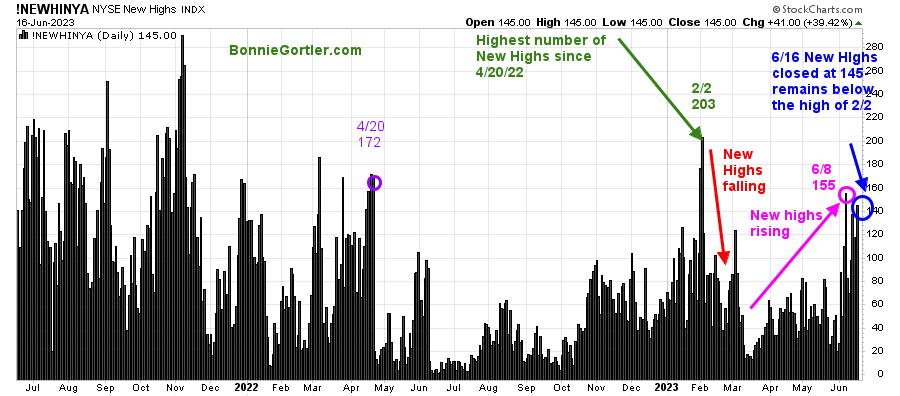
Figure 11: Daily New York Stock Exchange (NYSE) New Highs
061623 NYSE New Highs Daily
Source: Stockcharts.com
New highs have been rising in June. However, they did not get above the February high of 203. For the rally to be sustainable, you want to see an increase of New Highs to more than 203 made on 2/2 and continue to expand and New Lows (Figure 10) to stay in the lowest risk zone below 25.
On the other hand, two closes above 150 New Lows would imply an increased risk of a decline forthcoming.
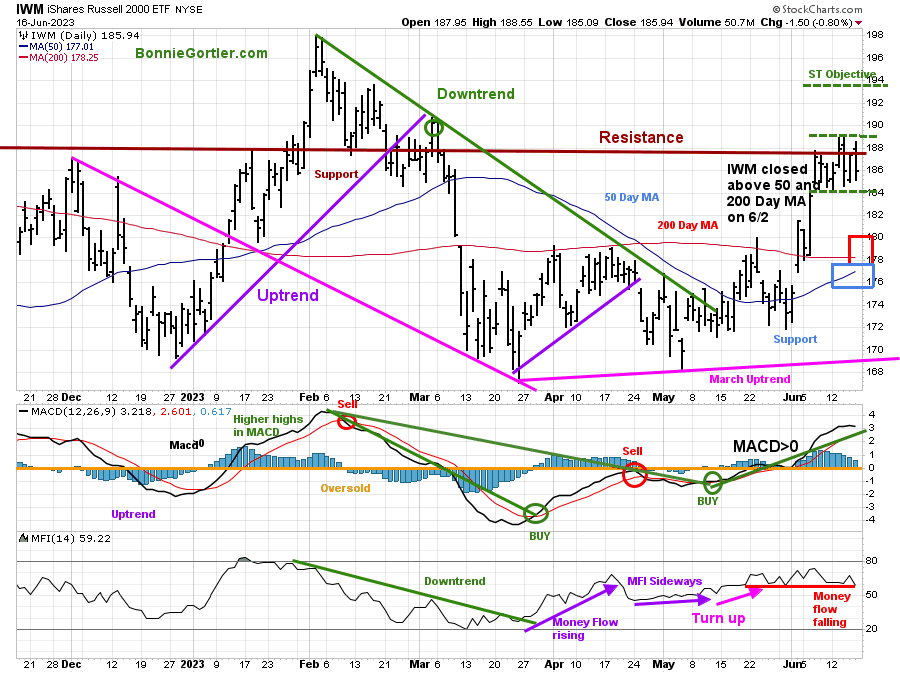
Small Caps consolidated last week.
Figure 12: Daily iShares Russell 2000 (IWM) Price (Top) and 12-26-9 MACD (Middle and Money Flow (Bottom)
061623 IWM Daily
Source: Stockcharts.com
The top chart is the daily iShares Russell 2000 Index ETF (IWM), the benchmark for small-cap stocks, with a 50-Day Moving Average (MA) (blue line) and 200-Day Moving Average (MA) (red line) that traders watch and use to define trends.
IWM underperformed the major averages last week, up +0.49%, closing at 185.94. However, IWM remained above the 200-Day MA (red rectangle) and the 50-Day MA (blue rectangle), implying underlying strength.
Resistance remains at 188.00, where IWM broke down in March with a short-term objective at 193.00. Support is at 184.00, 178.00, and 169.00.
MACD (middle chart) is on a buy, above 0, starting to roll over, but in an uptrend from May (green line), which is positive. Weekly MACD (chart not shown) is also on a buy, rising above 0.
Money Flow (lower chart) is falling, holding support above 50. An immediate turn-up would be positive, yet a further decline in MFI would imply a lack of interest.
IWM has acted better in June and is likely to attract more buying if IWM can close above resistance at 188.00 with MACD and Money Flow rising.
Nasdaq Touches Upper Channel
Figure 13: Nasdaq Composite
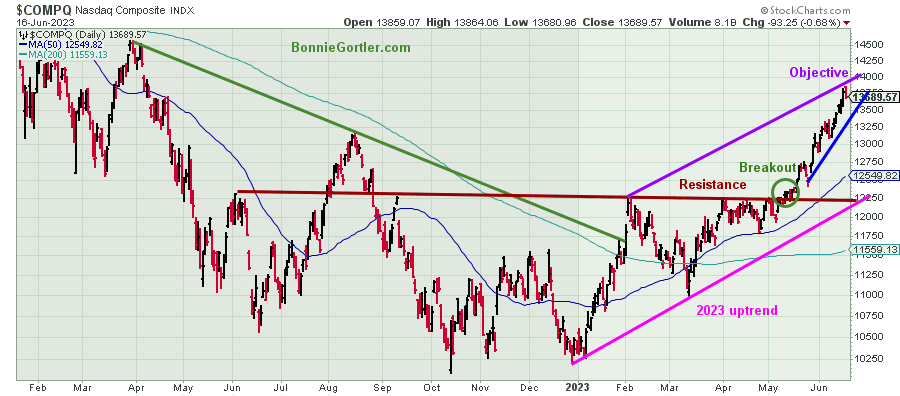
061623 Nasdaq Composite Daily
Source: Stockcharts.com
After Nasdaq penetrated resistance of 12300 in May, Nasdaq continued higher in an uptrend, making higher highs and higher lows during its eight-week winning streak.
Nasdaq closed at 13689.57, up +3.25% last week, reaching its upside channel objective at 13850 and then turned down. However, it’s positive the pattern of higher highs and lows implies more upside.
Support is at 13250, followed by 12250. Resistance is at 14000, followed by 14250 and 14500.
Overhead Resistance Remains
Figure 14: Dow Jones Industrial Average
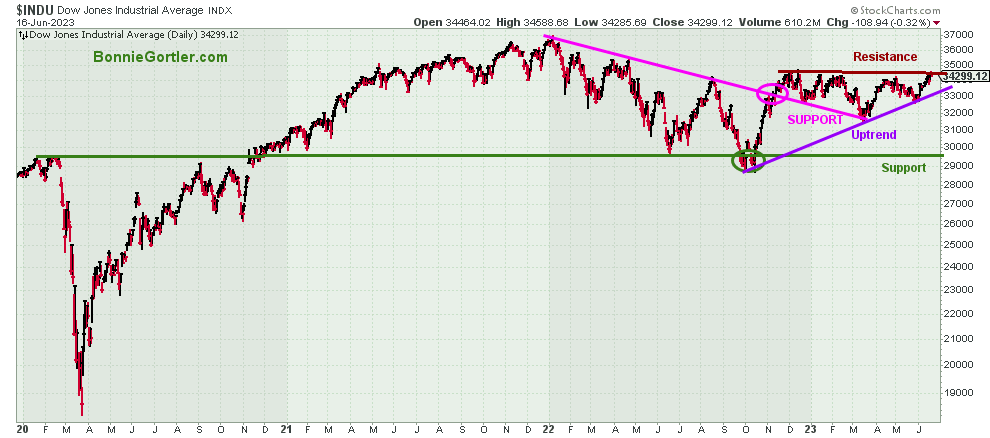
061623 Dow Jones Industrial Daily
Source: Stockcharts.com
The Dow Jones Industrial Average trended higher, gaining +1.25%, closing at 34299, down on Friday but slightly above resistance at 34250. A close above 34250 would confirm the potential breakout and could fuel further gains in Dow stocks as investors rotate into Dow stocks that have underperformed in 2023 and acting much better.
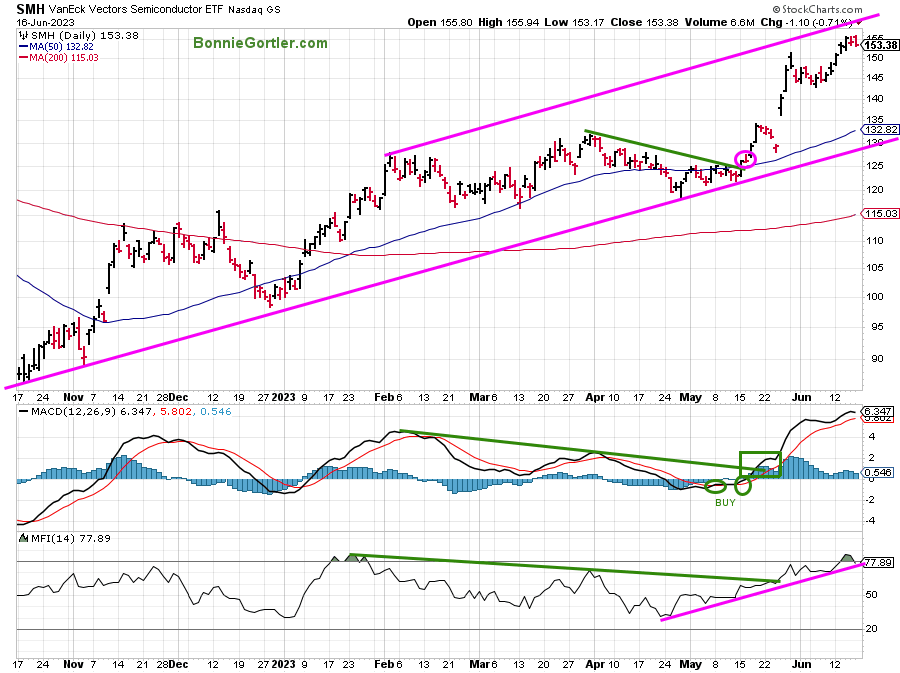
Figure 15: Daily Vaneck Vectors Semiconductors (SMH) Price (Top) and 12-26-9 MACD (Middle) and Money Flow (Bottom)
061623 SMH Daily
Source: Stockcharts.com
The top chart shows the Daily Semiconductors (SMH) ETF, concentrated mainly in US-based Mega-Cap Semiconductors companies. SMH tends to be a lead indicator for the market when investors are willing to take on increased risk and the opposite when the market is falling.
Semiconductors (SMH) continued its winning ways, gaining +4.45 % after consolidating during the last few weeks and led the market higher.
MACD (middle chart) has confirmed the new high but momentum has started to flatten and could give a sell on any weakness in SMH.
Money Flow (lower chart) remains in an uptrend (pink line), falling and is close to breaking its uptrend.
The SMH daily upside objective of 155.00 was met during the week. However, since the slope of the channel is rising, as time moves forward, the new upside channel objective is 160.00. Support is at 150.00, 140.00, 135.00, and 128.00.
Do you like charts, I invite you to join my FB group Wealth Through Market Charts.
Figure 16: Daily Invesco QQQ Trust (QQQ) Price (Top) and 12-26-9 MACD (Middle)
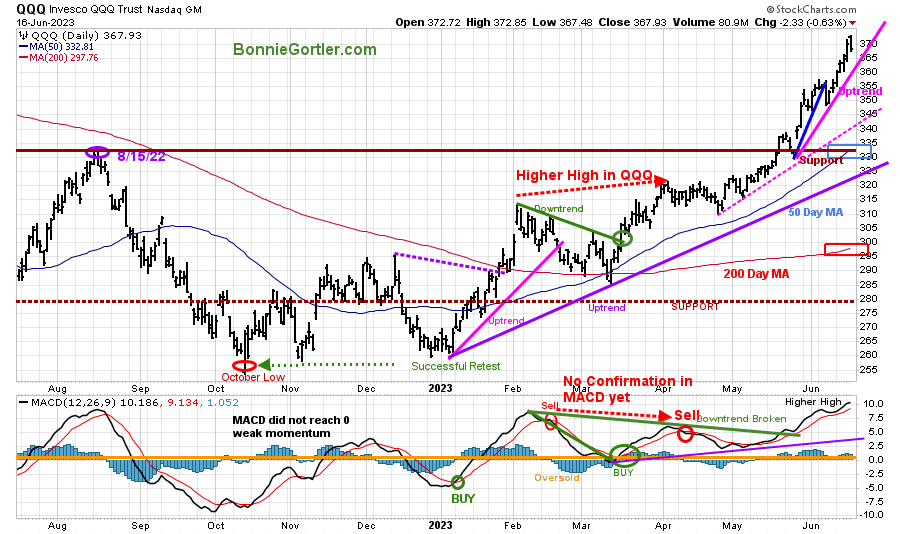
Source: Stockcharts.com
The chart shows the daily Invesco QQQ, an exchange-traded fund based on the Nasdaq 100 Index. QQQ made a low in October 2022 (red circle), followed by a successful retest of the low in early January 2023 and the start of a strong uptrend which remains in effect.
QQQ rose +3.79% last week, closing at 367.93, rebounding from breaking the steep May uptrend (blue line) the previous week after remaining above the rising 50-Day Moving Average (blue rectangle) and the 200-Day Moving Average (red rectangle).
Support is at 360.00, 340.00, 335.00, and 320.00. The upside objective is 380.00.
The bottom chart is MACD (12, 26, 9), a measure of momentum remains on a sell because MACD didn’t reset, falling below 0. However, it’s favorable that MACD broke the February downtrend (green line) and made a higher high confirming the price high.
The intermediate trend of QQQ remains up (chart now shown), with a pattern of higher highs and higher lows, reaching its first objective of 360.00 and its second objective of 370.00. (see the Market Update 06/02/23 for further analysis. There is a chance the QQQ will continue to rise toward its old high of November 2021 of 404.58 before any significant correction will occur, especially with potential quarterly window dressing fast approaching.
Figure 17: Weekly APPLE (AAPL) Price (Top) and 12-26-9 MACD (Bottom)
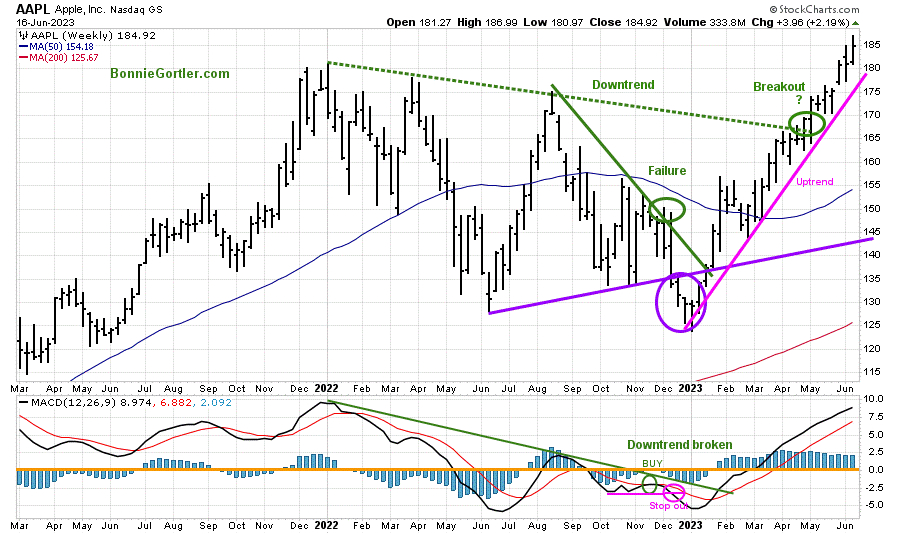
061623 AAPL Weekly
Source: Stockcharts.com
Apple (AAPL), the largest holding in QQQ, continues to rise after breaking the December 2022 downtrend (green dotted line),
The 2023 weekly uptrend remains in effect.
MACD remains on a buy and continues to rise with no sign of a sell signal.
The first support is at 175.00, followed by 165.00, with an upside target of 205.00.
Figure 18: The S&P 500 Index (SPY) Daily (Top) and 12-26-9 MACD (Bottom)
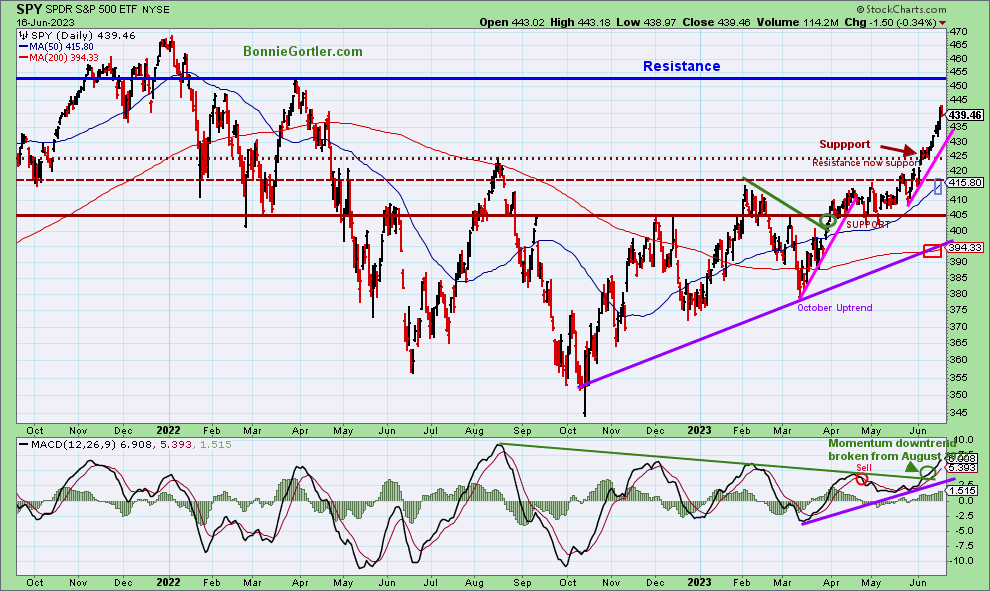
061723 SPY Daily
Source: Stockcharts.com
The S&P 500 (SPY) has been in an uptrend since October 2022.
SPY rose +2.60% for the fifth consecutive week of gains, closing near its upper range, slightly below 440.00 resistance penetrated on Friday before closing at 439.46.
SPY remains above the 50-Day Moving Average (blue rectangle) and the 200-Day Moving Average (red rectangle), a sign of underlying strength.
MACD (bottom chart) remains on a sell as it never went below 0 to generate a new buy, a sign of internal strength. However, it was positive that SPY broke the momentum downtrend (green trend line) from August 2022, implying more room for the upside.
Resistance is at 440.00, followed by 452.00. Support is at 430.00, 425.00, 415.00, 405.00, and 395.00
The bulls remain in control until proven otherwise.
Figure 19: The S&P 500 Index (SPY) Weekly (Top) and 12-26-9 MACD (Bottom)
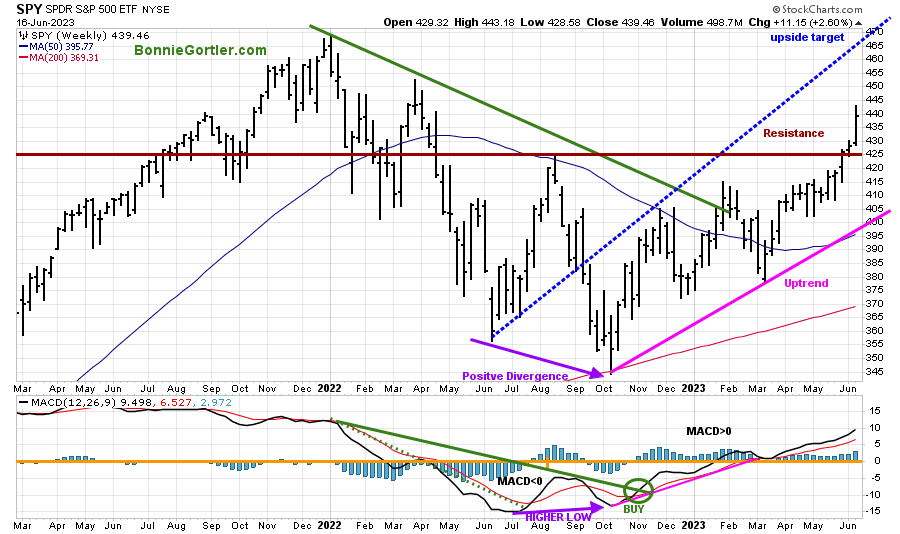
061623 SPY Weekly
Source: Stockcharts.com
The top chart shows the weekly S&P 500 Index (SPY) in an intermediate uptrend that began in October.
MACD (lower chart) remains on a buy (green circle), breaking the 2022 downtrend in November 2022, and continues to rise above 0, reaching the highest levels since January 2022.
SPY has an upside target of 468 and rising (blue dotted line) and potentially higher if support at 425.00 holds.
Learn more about charting in my free Masterclass, Charting Strategies to Cut Risk and Trade with the Trend. Sign up here.
Small, Mid, and Micro Caps remain in an uptrend.
Figure 20: Daily SPDR S&P 500 ETF Trust (SPY), (Top) and below SPDR S&P MidCap 400 (MDY), iShares Core S&P Small-Cap (IJR), and iShares Micro-Cap (IWC) ETF
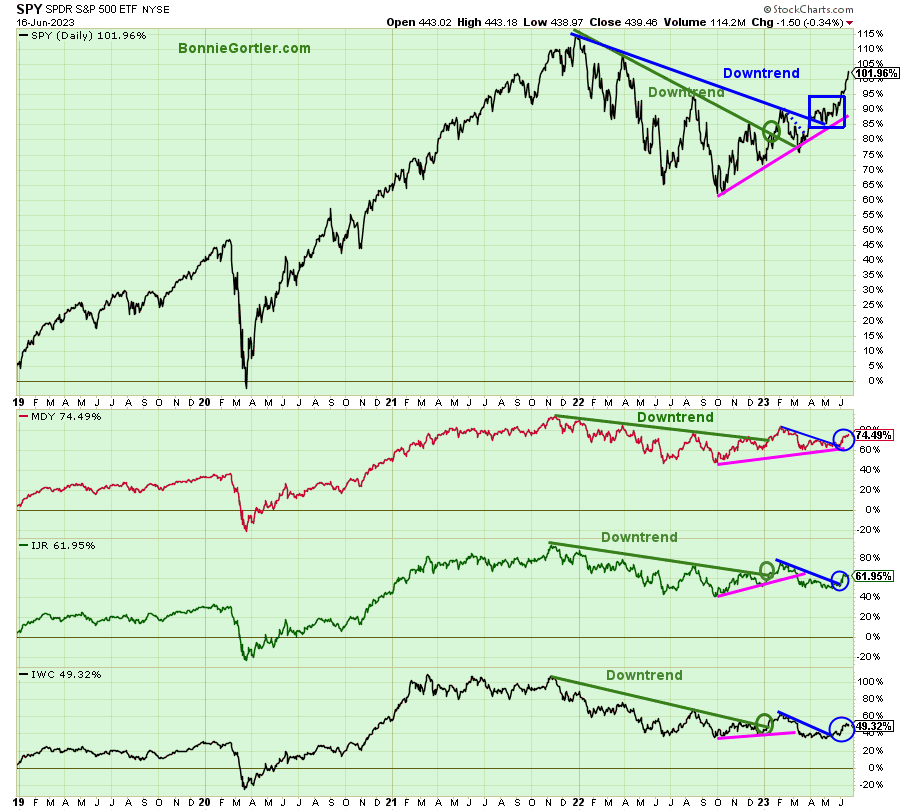
061623 SPY MDY, IJR, and IWC ETF Daily
Source: Stockcharts.com
The above chart is The SPDR S&P 500 ETF Trust (SPY), SPDR S&P MidCap 400 ETF (MDY), iShares Core S&P Small-Cap (IJR), and iShares Micro-Cap (IWC). All four ETFs broke the longer-term downtrends earlier this year (green lines), but there was no significant follow-through other than the S&P 500 (SPY).
However, Small and Mid-Cap stocks have joined the rally. All ETFs remain above their downtrends (blue line and circle) and their May highs.
MDY gained +1.22% last week, IWC was up 0.35%, and IJR was up 0.28%. Outperformance by all three averages next week would imply higher prices. Contact me at Bonnie@BonnieGortler.com if you want to go deeper into the charts or have any questions.
Price action where MDY, IJR, and IWC are stronger than the SPY would imply more strength ahead, showing the advance is broadening.
Summing Up:
Major averages advanced last week, with the Nasdaq up for the fifth positive month out of the last six months. The Dow closed slightly above resistance at 34250 and is in the middle of its best month since last November. Upside momentum increased in Technology and Semiconductors, remaining in an uptrend. Smallcap, Microcap, and Mid Cap stocks interest by investors was less before the completion of the annual rebalancing in the Russell 2000 indexes on June 26th. Despite short-term sentiment showing greed, the tape remains positive with the bulls in control.
Remember to manage your risk, and your wealth will grow.
Let’s talk investing. You are invited to set up your Free 30-minute Wealth and Well-Being Strategy session by clicking here or emailing me at Bonnie@BonnieGortler.com. I would love to schedule a call and connect with you.
Disclaimer: Although the information is made with a sincere effort for accuracy, it is not guaranteed that the information provided is a statement of fact. Nor can we guarantee the results of following any of the recommendations made herein. Readers are encouraged to meet with their own advisors to consider the suitability of investments for their own particular situations and for determination of their own risk levels. Past performance does not guarantee any future results.


Create more wealth in your life
with these simple strategies.
As an added bonus you will also
receive BG’s Updates and Ezine

Discover how to quickly create more well-being in your life with these simple strategies.
As an added bonus you will also
receive BG’s Updates and Ezine

As an added bonus you will receive BG’s Updates and Ezine

All work listed on BonnieGortler.com is licensed under a Creative Commons Attribution - Noncommercial - No Derivative Works 3.0 Unported License.


Free Report:
Grow and Sustain Your Wealth
Discover how to grow your money with these easy, simple steps.

