

10 Simple Tips for Financial Well-Being
07/01/2026
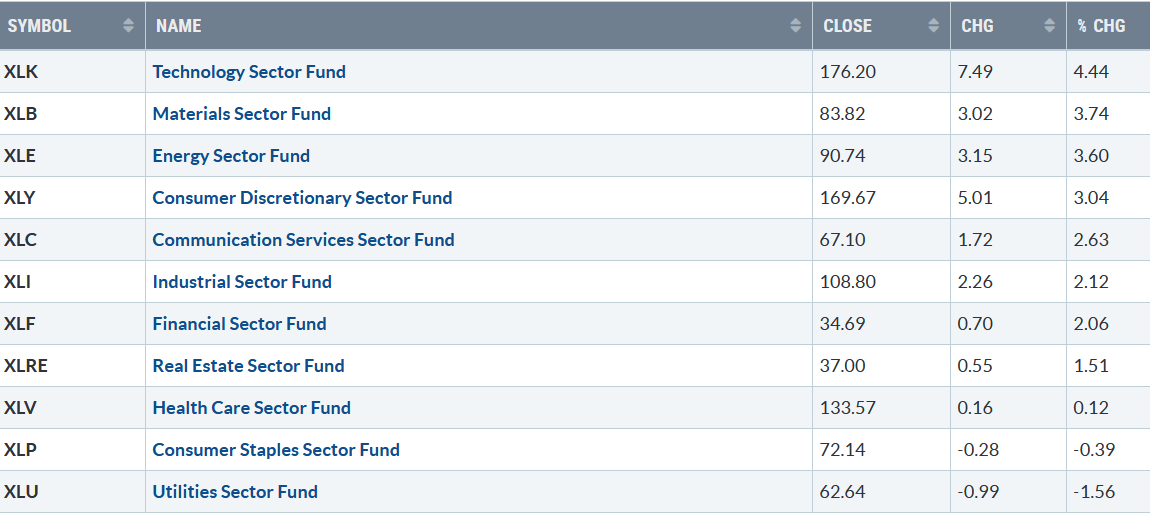
The market rebounded last week, ending August with nine of eleven S&P SPDR sectors finishing higher. Technology (XLK) and Materials (XLB) were the leading sectors, while Consumer Staples (XLP) and Utilities (XLU) were the weakest. The SPDR S&P 500 ETF Trust (SPY) was up +2.55%.
S&P SPDR Sector ETFs Performance Summary 8/25/23-9/1/23

090123 SPDR Sectors
Source: Stockcharts.com
Figure 2: Bonnie’s ETFs Watch List Performance Summary 8/25/23-9/1/23
080123 Week ETFs
Source: Stockcharts.com
Semiconductors, China, Small Cap Value and Growth, and Technology were leaders, while Transports and Europe gained, although not as much.
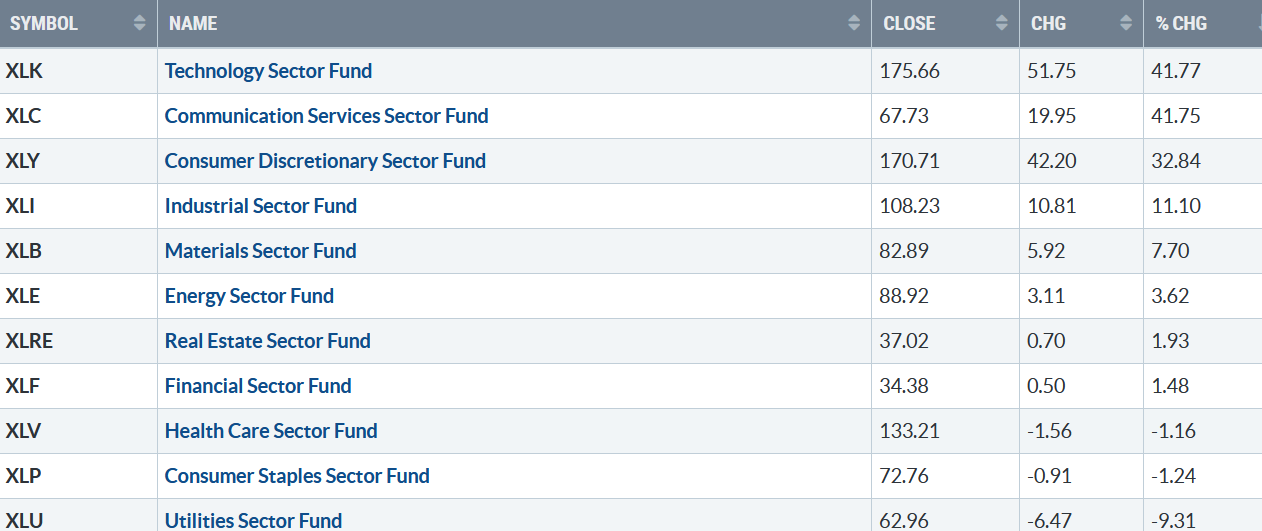
Figure 3: S&P SPDR Sector ETFs Performance 12/31/22 – 8/31/23
083123 YTD SPDR Sectors Performance
Source: Stockcharts.com
Through August, Technology and Communications had the biggest gains in 2023, while Healthcare, Consumer Staples, and Utilities underperformed and were down.
Support held on the recent decline, but overhead Resistance Remains
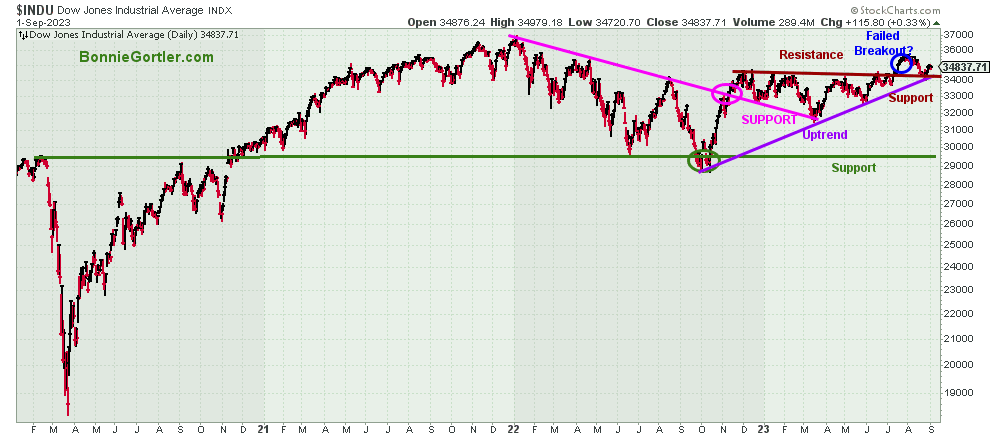
Figure 4: Dow Jones Industrial Average
090123 Dow Jones Industrial Daily
Source: Stockcharts.com
The Dow Jones Industrial Average rose +1.67%, closing at 34837.71, holding key support but below August highs.
It remains positive the October 2022 price uptrend remains in effect. Two closes above 35567 could fuel Dow stocks that underperformed in 2023 and confirm the recent pullback was only a normal retracement after the breakout above resistance. On the other hand, a close below the low of last week would be negative.
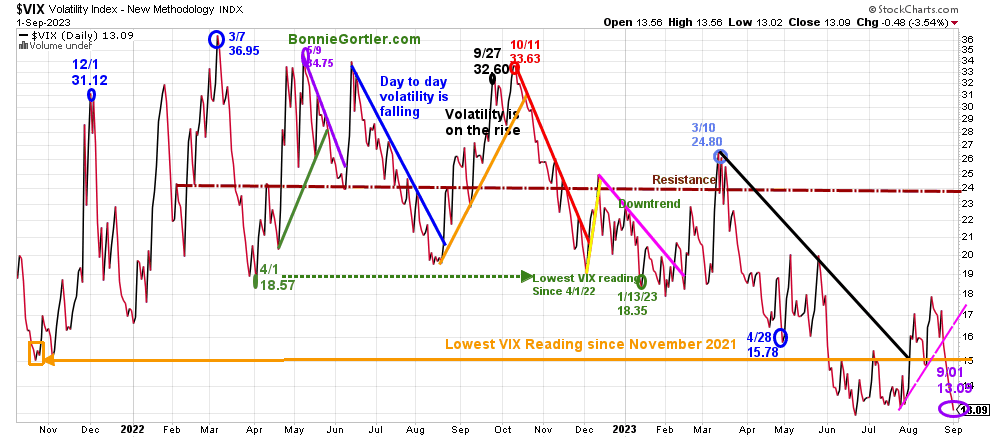
Figure 5: CBOE Volatility Index VIX
090123 VIX Daily
Source: Stockcharts.com
The CBOE Volatility Index (VIX), a measure of fear, traded above 20.00 for most of 2022, with a high at 36.95 on 3/7 (blue circle). A new VIX low did not occur until 1/13/23 at 18.35 (green circle) after peaking in October 2022 at 33.63 (red circle).
VIX declined sharply, breaking the uptrend from July (pink line), dropping from 15.68 the previous week to close at 13.09 (purple circle) last week, once again near the lows for the year and lowest weekly close since January 2020.
Expect quiet intraday volatility with VIX below 20. A close above 20.00 would imply volatility increasing.
Figure 6: UST 10YR Bond Yields Daily
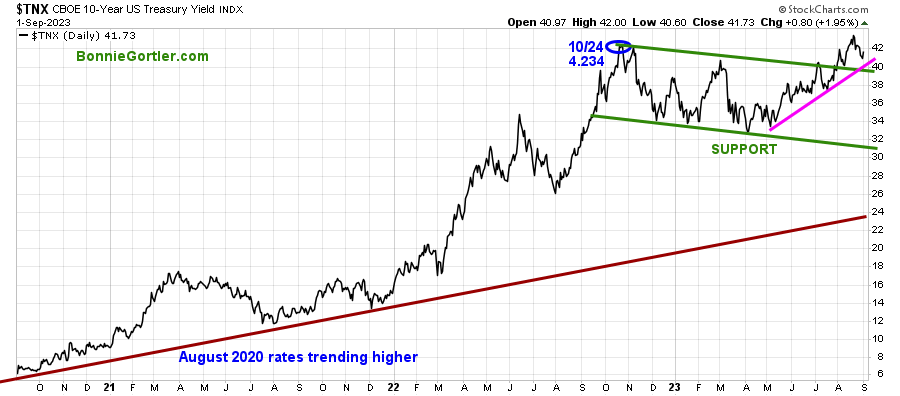
090123 UST 10 Yr Bond Yields Daily
Source: Stockcharts.com
The 10-year U.S. Treasury yields fell last week, closing at 4.173%, remaining above the channel and the May uptrend (pink line). Support is 4.00 and 3.80%. A close breaking the May uptrend, below 3.80%, is likely to be positive for equities.
On the other hand, a close above 4.50% would likely lead to a short-term correction in equities.
Last week, the major market averages were all higher. The Dow gained +1.48%, the S&P 500 rose +2.50 %, the Nasdaq gained +3.25%, back-to-back solid gains, while the Russell 2000 Index rose +3.63%, the strongest market average.
Figure 7: Value Line Arithmetic Average
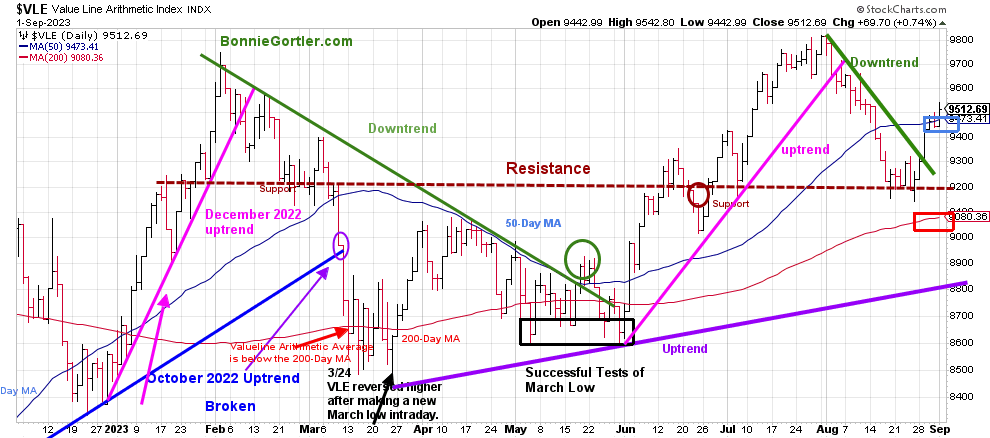
090123 VLE Daily
Source: Stockcharts.com
The Value Line Arithmetic Index ($VLE) is a mix of approximately 1700 stocks. VLE broke the October 2022 uptrend in early March (blue line), reversed higher, and in April, May, and June had successful tests of the low.
The uptrend remains intact from March (purple line).
Last week, VLE rose +3.09%, flipping back above the 50-day MA (blue rectangle), a sign of underlying strength, and above the 200-day MA (red rectangle).
VLE broke the short-term downtrend from July (green line) and penetrated resistance at 9300 before closing slightly above 9500 at 9512.69. The next resistance is 9700.
Support is at 9200 and 8800. Two closes below 8800 would break the March uptrend and be a warning of a potentially upcoming serious decline.
Do you want to go deeper into charting? Learn more in the comfort of your home today with my Free 33-minute Training, Charting Strategies to Cut Risk and Trade with the Trend. Sign up here
Weekly market breadth was positive on the New York Stock Exchange Index (NYSE) and for the Nasdaq. The NYSE had 2388 advances and 677 declines, with 214 new highs and 88 new lows. There were 3226 advances and 1549 declines on the Nasdaq, with 227 new highs and 379 new lows.
It’s positive that market breadth improved in the near term, with fewer stocks making weekly New Lows and more stocks making weekly New Highs on the NYSE and Nasdaq. For the rally to be sustainable, breadth needs to continue to improve.
If you want to go more in-depth with charts, I invite you to join my FB group Wealth Through Market Charts.
Keep an eye on Nasdaq breadth.
Figure 8: Nasdaq Advance Decline Line Daily (Top) and Nasdaq (Bottom)
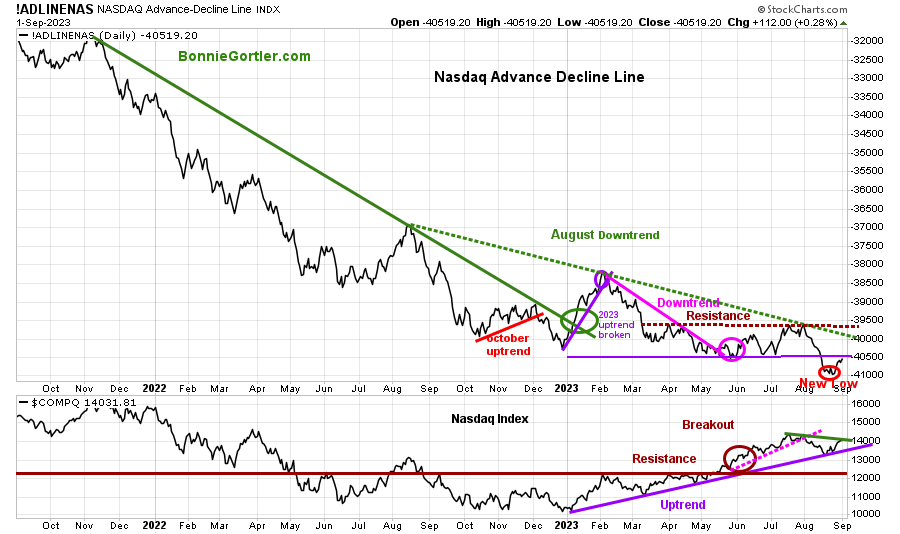
090123 Daily Nasdaq Cumulative Advance-Decline Line
Source: Stockcharts.com
The top chart is the Nasdaq Daily Advance-Decline Line, a technical indicator that plots the difference between the number of advancing and declining stocks. In January 2023, the October 2022 downtrend was broken (solid green line) but quickly reversed lower in February 2023, when most of the stock participation was the large Mega Cap Stocks.
The AD-Line (top chart) broke support (purple line) in August, making a new low.
Nasdaq (lower chart) broke the short-term downward trend from July (pink dotted line), but the 2023 uptrend remained intact.
It would be positive if Nasdaq moves higher this week with more stocks advancing than declining. However, if the opposite is true, last week’s rally will likely fail.
Figure 9 Daily Nasdaq New Lows
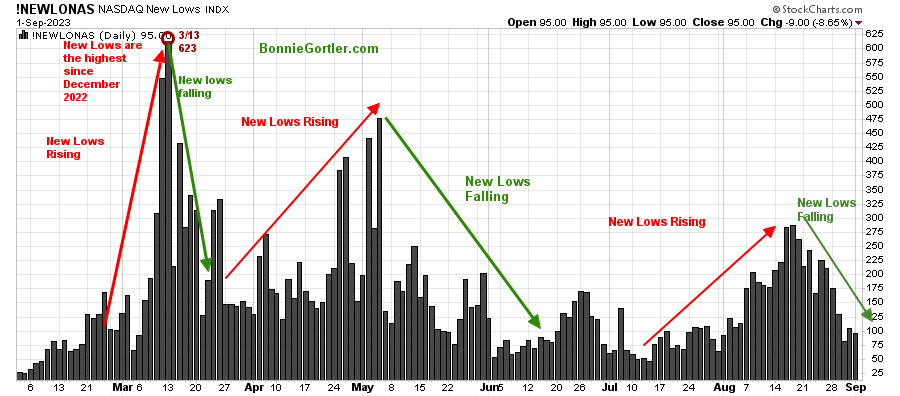
090123 Nasdaq New Lows Daily
Source: Stockcharts.com
Nasdaq’s New lows began to increase in July. However, during the pullback in August, it was positive they did not reach the May high and then began to fall. It would be positive in the near term to see Nasdaq New Lows continue to decline.
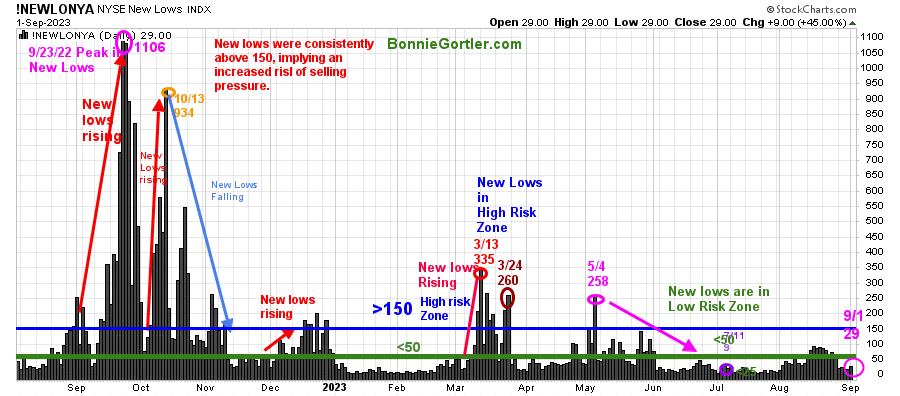
Figure 10: Daily New York Stock Exchange (NYSE) New Lows
090123 NYSE New Lows Daily
Source: Stockcharts.com
Watching New Lows on the New York Stock Exchange is a simple technical tool that helps awareness of the immediate trend’s direction. New lows warned of a potential sharp pullback, high volatility, and “panic selling” for most of 2022, closing above 150. The peak reading was 9/23/22 when New Lows made a new high of 1106 (pink circle), and New Lows expanded to their highest level in 2023 on 3/13/23 (red circle) to 335.
New Lows closed at 29 (purple circle) in a low-risk zone. It will be bullish if New Lows fall and stay below 25 (the lowest risk zone).
On the other hand, two closes above 150 New Lows would imply an increased risk of downside pressure in equities that could accelerate.
Learn more about the significance of New Lows in my book, Journey to Wealth, published on Amazon. If you would like a preview, get a free chapter here.
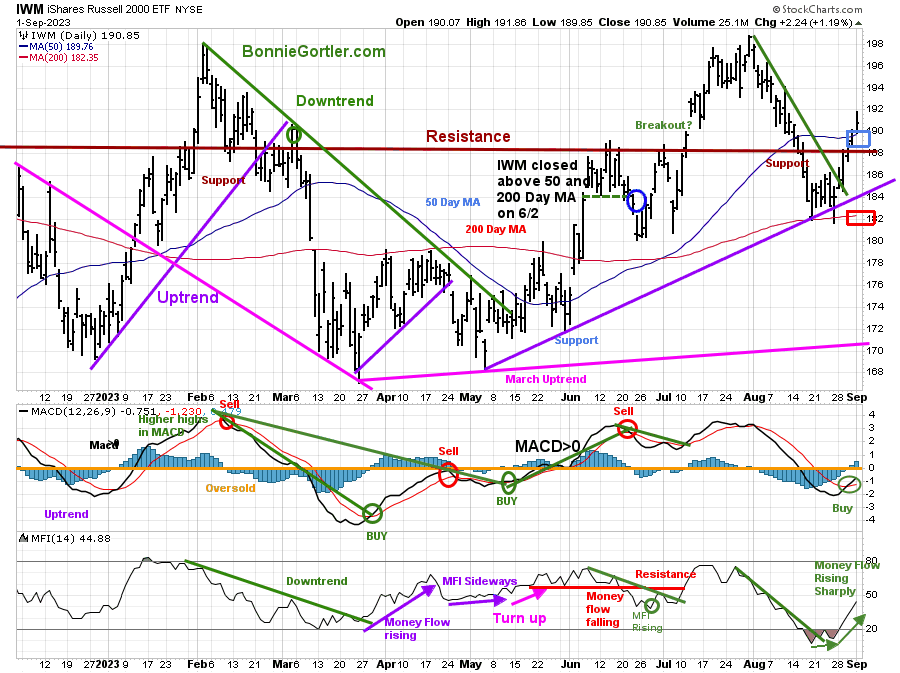
Figure 11: Daily iShares Russell 2000 (IWM) Price (Top) and 12-26-9 MACD (Middle and Money Flow (Bottom)
090123 IWM Daily
Source: Stockcharts.com
The top chart is the daily iShares Russell 2000 Index ETF (IWM), the benchmark for small-cap stocks, with a 50-Day Moving Average (MA) (blue line) and 200-Day Moving Average (MA) (red line) that traders watch and use to define trends.
IWM rose +3.72%, closing at 190.85, flipping from below the 50-day MA (blue rectangle) to above and above key resistance at 188.00, where IWM broke down in March.
Support is at 188.00, 182.00, and 170.00.
MACD (middle chart) generated a buy, above 0, and rising.
Money Flow (lower chart) trended down in July, rising and turning up sharply from an oversold condition in August, implying money is flowing into small caps. Valuations of Small-Cap stocks remain historically cheap vs. Large Cap stocks.
Momentum improving, no longer accelerating lower.
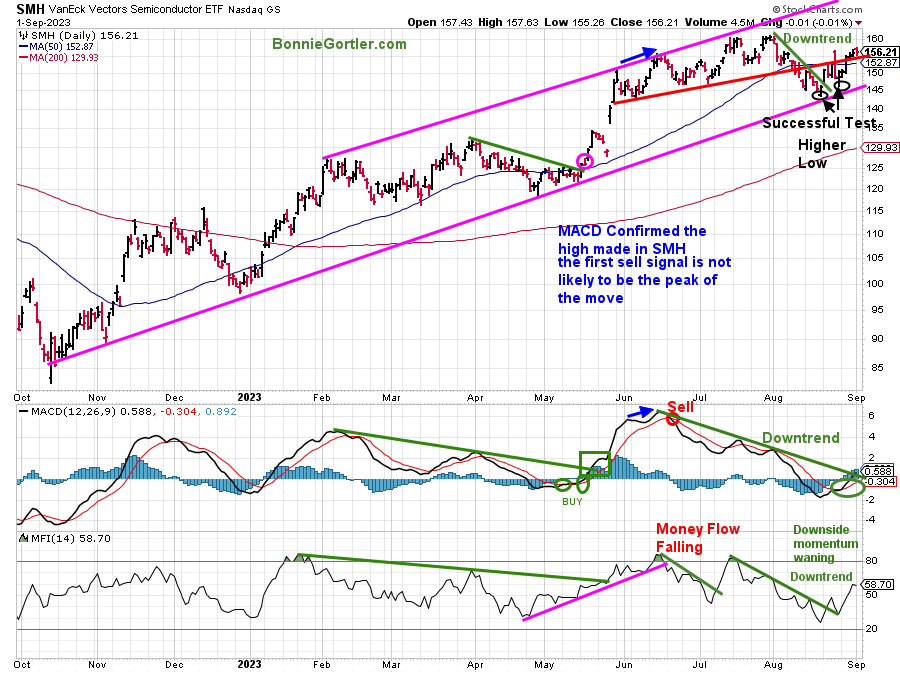
Figure 12: Daily Vaneck Vectors Semiconductors (SMH) Price (Top) and 12-26-9 MACD (Middle) and Money Flow (Bottom)
090123 SMH Daily
Source: Stockcharts.com
The top chart shows the Daily Semiconductors (SMH) ETF, concentrated mainly in US-based Mega-Cap Semiconductors companies. SMH tends to be a lead indicator for the market when investors are willing to take on increased risk and the opposite when the market is falling.
Semiconductors (SMH) showed strength last week, up +4.78%. SMH successfully tested the August low while remaining in an uptrend from November 2022 (bottom pink line).
Support is at 152.00, 145.00, and 140.00. Resistance is at 160.00.
MACD (middle chart) is on a fresh buy with gains last week, as mentioned in Market Update 8/25/23. It’s positive MACD will likely break the momentum downtrend (green line) from June.
Money Flow (lower chart) broke its uptrend from July (green line), rising sharply above 50, which is positive.
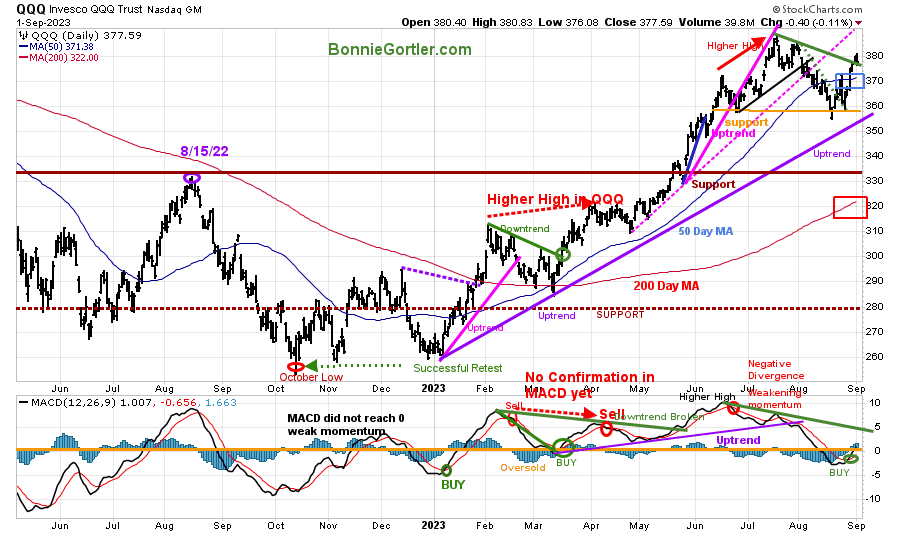
Figure 13: Daily Invesco QQQ Trust (QQQ) Price (Top) and 12-26-9 MACD (Middle) and Money Flow (Bottom)
090123 QQQ Daily
Source: Stockcharts.com
The chart shows the daily Invesco QQQ, an exchange-traded fund based on the Nasdaq 100 Index. QQQ made a low in October 2022 (red circle), followed by a successful retest of the low in early January 2023 and the start of a strong uptrend.
QQQ remains in an uptrend for 2023 but trended down since July’s peak.
Last week, QQQ broke the downtrend, gaining +3.73%, closing at 377.59. QQQ crossed above the 50-day Moving Average (blue rectangle), penetrating 370.00 resistance, while remaining above the 200-day Moving Average (red rectangle).
The bottom chart is MACD (12, 26, 9), on a buy generated last week, below 0 and rising.
Support is at 370.00, 360.00, and 335.00. with resistance at 380.00 and 390.00.
The downside momentum has subsided. Watch closely for confirmation of strength if MACD breaks the June downtrend, implying higher prices ahead.
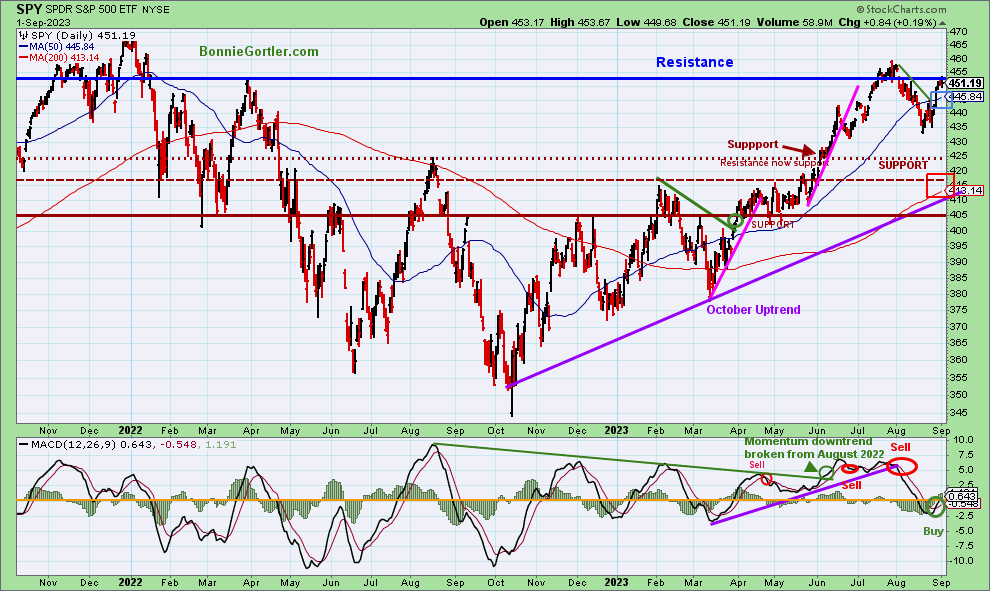
Figure 14: The S&P 500 Index (SPY) Daily (Top) and 12-26-9 MACD (Bottom)
090123 SPY Daily
Source: Stockcharts.com
The S&P 500 (SPY) remains in an uptrend since October 2022.
SPY rose +2.55%, closing at 451.19, above the 50-day Moving Average (blue rectangle) and above the 200-day Moving Average (red rectangle).
MACD (bottom chart) went on a buy, below 0 and rising.
Resistance is 452.00 and 460.00. Support is at 445.00, 425.00, 415.00, and 405.00.
SPY closed slightly under resistance but near its high of the week. With MACD on a buy, support holding, and the uptrend in effect, look for further gains in the near term.
Summing Up:
It is positive the major averages held support levels after a weak August. Although September is historically a weak month, the weakness may not occur this year, with many August downtrends broken last week, a positive tape, and short-term momentum oscillators rising, no longer accelerating downward, in a position from where tradeable rallies occur. Watch for strength in Small Caps and Technology to lead the broad market higher this week. The retracement in August seems normal after a strong start in 2023. Higher prices are likely as long as support levels remain intact. Remember to manage your risk, and your wealth will grow.
Let’s talk investing. You are invited to set up your Free 30-minute Wealth and Well-Being Strategy session by clicking here or emailing me at Bonnie@BonnieGortler.com. I would love to schedule a call and connect with you.
Disclaimer: Although the information is made with a sincere effort for accuracy, it is not guaranteed that the information provided is a statement of fact. Nor can we guarantee the results of following any of the recommendations made herein. Readers are encouraged to meet with their own advisors to consider the suitability of investments for their own particular situations and for determination of their own risk levels. Past performance does not guarantee


Create more wealth in your life
with these simple strategies.
As an added bonus you will also
receive BG’s Updates and Ezine

Discover how to quickly create more well-being in your life with these simple strategies.
As an added bonus you will also
receive BG’s Updates and Ezine

As an added bonus you will receive BG’s Updates and Ezine

All work listed on BonnieGortler.com is licensed under a Creative Commons Attribution - Noncommercial - No Derivative Works 3.0 Unported License.


Free Report:
Grow and Sustain Your Wealth
Discover how to grow your money with these easy, simple steps.

